

development report 2012 - UMAR
development report 2012 - UMAR
development report 2012 - UMAR

You also want an ePaper? Increase the reach of your titles
YUMPU automatically turns print PDFs into web optimized ePapers that Google loves.
74 Development Report <strong>2012</strong><br />
Development by the priorities of SDS – Integration of measures to achieve sustainable <strong>development</strong><br />
transport volumes (by 7.9%), which resulted in a drop in<br />
the share of road freight transport to 82.3% 244 . Based on<br />
data for the first three quarters of 2011, we estimate that<br />
the share of road freight transport in 2011 continued<br />
to decline (to 81.3%) 245 . Before 2010, the share of road<br />
transport continued to increase steadily, an unfavourable<br />
<strong>development</strong> in terms of sustainable transportation. In<br />
2010, the share of road freight transport in EU Member<br />
States decreased on average (to 76.5%), but the increase<br />
in freight volumes was less than in Slovenia. The modal<br />
split of freight transport in Slovenia is less favourable<br />
than the EU average, and freight transport volumes are<br />
extremely high due to Slovenia’s transit position. In 2010,<br />
Slovenian road transport operators transported 98%<br />
more tonne-kilometres 246 per inhabitant than the EU<br />
average, and the volume of rail transport per inhabitant<br />
was similarly above the EU average (114% higher). The<br />
growth in freight transport volumes was particularly<br />
high after Slovenia’s accession to the EU and the latter’s<br />
subsequent enlargement, while the unfavourable<br />
structure was stimulated by low prices for motor fuels<br />
and tolls for cargo vehicles before the onset of the crisis,<br />
and more modern road infrastructure than railway<br />
infrastructure.<br />
In public passenger transport, the trend of reduced bus<br />
transportation continued in 2010 and 2011. In 2008,<br />
public passenger traffic in Slovenia constituted only<br />
13.8% of the total passenger transport, which is much<br />
less than in the majority of EU Member States 247 . The<br />
high level of individualised forms of transport in Slovenia<br />
is corroborated by a higher share of passenger vehicles<br />
per inhabitant (Slovenia: 521 cars per 1,000 inhabitants,<br />
EU: 473 cars per 1,000 inhabitants), despite below<br />
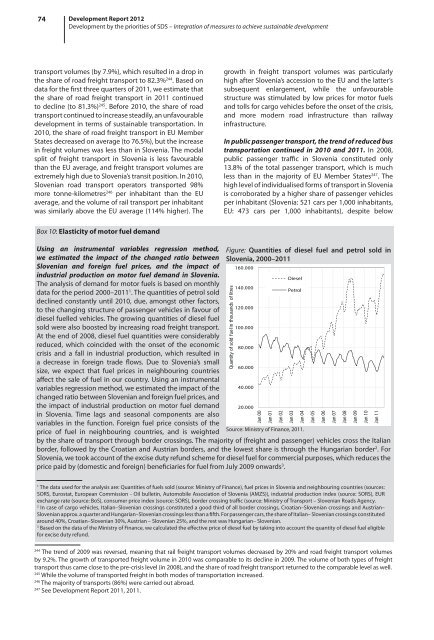
Box 10: Elasticity of motor fuel demand<br />
Using an instrumental variables regression method,<br />
we estimated the impact of the changed ratio between<br />
Slovenian and foreign fuel prices, and the impact of<br />
industrial production on motor fuel demand in Slovenia.<br />
The analysis of demand for motor fuels is based on monthly<br />
data for the period 2000–2011 1 . The quantities of petrol sold<br />
declined constantly until 2010, due, amongst other factors,<br />
to the changing structure of passenger vehicles in favour of<br />
diesel fuelled vehicles. The growing quantities of diesel fuel<br />
sold were also boosted by increasing road freight transport.<br />
At the end of 2008, diesel fuel quantities were considerably<br />
reduced, which coincided with the onset of the economic<br />
crisis and a fall in industrial production, which resulted in<br />
a decrease in foreign trade flows. Due to Slovenia’s small<br />
size, we expect that fuel prices in neighbouring countries<br />
affect the sale of fuel in our country. Using an instrumental<br />
variables regression method, we estimated the impact of the<br />
changed ratio between Slovenian and foreign fuel prices, and<br />
the impact of industrial production on motor fuel demand<br />
in Slovenia. Time lags and seasonal components are also<br />
variables in the function. Foreign fuel price consists of the<br />
price of fuel in neighbouring countries, and is weighted<br />
Figure: Quantities of diesel fuel and petrol sold in<br />
Slovenia, 2000–2011<br />
160.000<br />
140.000<br />
120.000<br />
100.000<br />
by the share of transport through border crossings. The majority of (freight and passenger) vehicles cross the Italian<br />
border, followed by the Croatian and Austrian borders, and the lowest share is through the Hungarian border 2 . For<br />
Slovenia, we took account of the excise duty refund scheme for diesel fuel for commercial purposes, which reduces the<br />
price paid by (domestic and foreign) beneficiaries for fuel from July 2009 onwards 3 .<br />
Quantity of sold fuel in thousands of litres<br />
80.000<br />
60.000<br />
40.000<br />
20.000<br />
Diesel<br />
Petrol<br />
Jan 00<br />
Jan 01<br />
Jan 02<br />
Jan 03<br />
Jan 04<br />
Jan 05<br />
Jan 06<br />
Jan 07<br />
Jan 08<br />
Jan 09<br />
Jan 10<br />
Jan 11<br />
Source: Ministry of Finance, 2011.<br />
1<br />
The data used for the analysis are: Quantities of fuels sold (source: Ministry of Finance), fuel prices in Slovenia and neighbouring countries (sources:<br />
SORS, Eurostat, European Commission - Oil bulletin, Automobile Association of Slovenia (AMZS)), industrial production index (source: SORS), EUR<br />
exchange rate (source: BoS), consumer price index (source: SORS), border crossing traffic (source: Ministry of Transport – Slovenian Roads Agency.<br />
2<br />
In case of cargo vehicles, Italian–Slovenian crossings constituted a good third of all border crossings, Croatian–Slovenian crossings and Austrian–<br />
Slovenian approx. a quarter and Hungarian–Slovenian crossings less than a fifth. For passenger cars, the share of Italian– Slovenian crossings constituted<br />
around 40%, Croatian–Slovenian 30%, Austrian – Slovenian 25%, and the rest was Hungarian– Slovenian.<br />
3<br />
Based on the data of the Ministry of Finance, we calculated the effective price of diesel fuel by taking into account the quantity of diesel fuel eligible<br />
for excise duty refund.<br />
244<br />
The trend of 2009 was reversed, meaning that rail freight transport volumes decreased by 20% and road freight transport volumes<br />
by 9.2%. The growth of transported freight volume in 2010 was comparable to its decline in 2009. The volume of both types of freight<br />
transport thus came close to the pre-crisis level (in 2008), and the share of road freight transport returned to the comparable level as well.<br />
245<br />
While the volume of transported freight in both modes of transportation increased.<br />
246<br />
The majority of transports (86%) were carried out abroad.<br />
247<br />
See Development Report 2011, 2011.


