

development report 2012 - UMAR
development report 2012 - UMAR
development report 2012 - UMAR

Create successful ePaper yourself
Turn your PDF publications into a flip-book with our unique Google optimized e-Paper software.
Development Report <strong>2012</strong><br />
Indicators of Slovenia’s <strong>development</strong><br />
181<br />
Table: Social protection expenditure in Slovenia and in the EU, as a % of GDP and in PPS per capita<br />
In % of GDP<br />
Per capita PPS, EU=100<br />
2000 2005 2006 2007 2008 2009 2000 2005 2006 2007 2008 2009<br />
EU 26.4 27 26.6 25.7(p) 26.7(p) 29.5(p) 100 100 100 100 100 100<br />
Austria 28.3 28.7 28.2 27.7 28.4 30.7 141 133 133 133 133 131<br />
Belgium 25.4 27.3 27 26.7 28.1 30.4 125 131 137 120 119 119<br />
Bulgaria 10.2 15.1 14.2 14.1 15.4 17.2 11 20 20 22 25 26<br />
Cyprus 14.8 18.3 18.5 18.1 18.5 20.9 50 62 62 66 68 71<br />
Czech Rep. 18.8 18.3 17.9 18.0 18.0 20.4 50 42 54 58 57 59<br />
Denmark 28.8 30.2 29.2 28.7 29.6 33.4 144 138 136 135 138 138<br />
Estonia 13.8 12.5 12.1 12.1 14.8 19.1 24 29 30 33 39 42<br />
Finland 25 26.7 26.4 25.3 26.1 30.2 111 113 113 116 117 118<br />
France 29.5 31.5 30.8 30.6 31 33(p) 129 128 125 128 121 119<br />
Greece 23.5 24.8 24.7 24.8 26.2 27.9 75 83 85 88 91 89<br />
Ireland 13.7 17.9 18.2 18.7 22 27.8 69 96 100 108 108 118<br />
Italy 24.7 26.3 26.6 26.7 27.8(p) 29.8(p) 109 102 104 107 107 104<br />
Latvia 15.6 12.8 12.6 11.2 12.7 16.8(p) 21 23 24 24 27 30<br />
Lithuania 15.7 13.2 13.3 14.4 16 21.2(p) 24 26 28 33 37 40<br />
Luxembourg 19.5 21.7 20.4 19.3 20.2 23.1 182 203 207 206 215 213<br />
Hungary 19.9 21.9 22.4 22.6 22.8 23.4 41 51 53 54 56 51<br />
Malta 16.5 18.4 18.3 18 18.4 20 55 53 52 54 55 56<br />
Germany 29.6 30 28.9 27.7 27.9 31.3(p) 131 128 125 124 121 122<br />
Netherlands 26.3 27.8 28.8 28.3 28.4 31.6(p) 134 134 141 146 140 136<br />
Poland 19.6 19.7 19.3 18.1 18.5 19.7 36 37 38 38 40 41<br />
Portugal 20.9 24.5 24.6 23.8 24.3 26.9 64 72 72 73 70 72<br />
Romania 13 13.4 12.8 13.5 14.2 17 13 17 18 22 25 27<br />
Slovakia 19.3 16.5 16.3 16 16 18.8(p) 37 37 39 42 43 47<br />
Slovenia 24.1 23 22.7 21.3 21.3 24.2(p) 73 74 74 73 74 73<br />
Spain 19.9 20.5 20.5 20.6 22.1 25(p) 75 79 81 86 87 89<br />
Sweden 29.8 31.1 30.6 29.2 29.5 32.1(p) 145 140 139 141 139 132<br />
UK 26.4 26.2 26 23.2 26.2 29.1(p) 119 118 117 106 112 111<br />
Source: Eurostat Portal Page – Social Protection – Expenditure on social protection, % of GDP, and Social benefits per head of population by function, PPS; <strong>2012</strong>; calculations by<br />
IMAD.<br />
Notes: PPS – purchasing power standards; p – preliminary data; data for Slovenia for 2000 exclude housing data.<br />
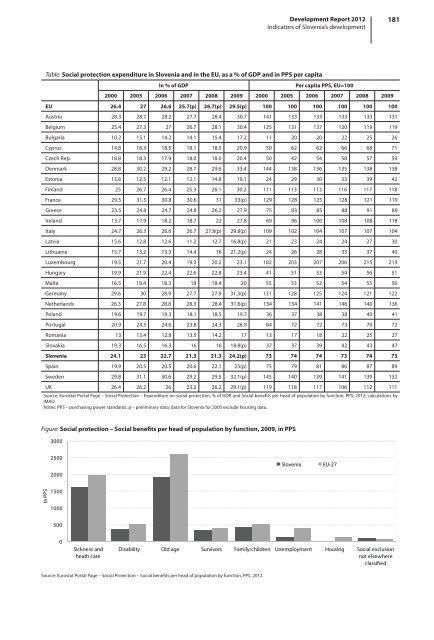
Figure: Social protection – Social benefits per head of population by function, 2009, in PPS<br />
3000<br />
2500<br />
2000<br />
Slovenia<br />
EU-27<br />
In PPS<br />
1500<br />
1000<br />
500<br />
0<br />
Sickness and<br />
heath care<br />
Disability Old age Survivors Family/children Unemployment Housing Social exclusion<br />
not elsewhere<br />
classified<br />
Source: Eurostat Portal Page – Social Protection – Social benefits per head of population by function, PPS, <strong>2012</strong>.


