

development report 2012 - UMAR
development report 2012 - UMAR
development report 2012 - UMAR

You also want an ePaper? Increase the reach of your titles
YUMPU automatically turns print PDFs into web optimized ePapers that Google loves.
Development Report <strong>2012</strong><br />
Indicators of Slovenia’s <strong>development</strong><br />
227<br />
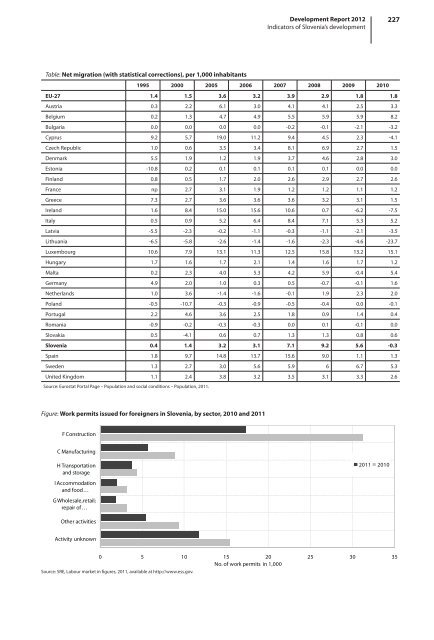
Table: Net migration (with statistical corrections), per 1,000 inhabitants<br />
1995 2000 2005 2006 2007 2008 2009 2010<br />
EU-27 1.4 1.5 3.6 3.2 3.9 2.9 1.8 1.8<br />
Austria 0.3 2.2 6.1 3.0 4.1 4.1 2.5 3.3<br />
Belgium 0.2 1.3 4.7 4.9 5.5 5.9 5.9 8.2<br />
Bulgaria 0.0 0.0 0.0 0.0 -0.2 -0.1 -2.1 -3.2<br />
Cyprus 9.2 5.7 19.0 11.2 9.4 4.5 2.3 -4.1<br />
Czech Republic 1.0 0.6 3.5 3.4 8.1 6.9 2.7 1.5<br />
Denmark 5.5 1.9 1.2 1.9 3.7 4.6 2.8 3.0<br />
Estonia -10.8 0.2 0.1 0.1 0.1 0.1 0.0 0.0<br />
Finland 0.8 0.5 1.7 2.0 2.6 2.9 2.7 2.6<br />
France np 2.7 3.1 1.9 1.2 1.2 1.1 1.2<br />
Greece 7.3 2.7 3.6 3.6 3.6 3.2 3.1 1.5<br />
Ireland 1.6 8.4 15.0 15.6 10.6 0.7 -6.2 -7.5<br />
Italy 0.5 0.9 5.2 6.4 8.4 7.1 5.3 5.2<br />
Latvia -5.5 -2.3 -0.2 -1.1 -0.3 -1.1 -2.1 -3.5<br />
Lithuania -6.5 -5.8 -2.6 -1.4 -1.6 -2.3 -4.6 -23.7<br />
Luxembourg 10.6 7.9 13.1 11.3 12.5 15.8 13.2 15.1<br />
Hungary 1.7 1.6 1.7 2.1 1.4 1.6 1.7 1.2<br />
Malta 0.2 2.3 4.0 5.3 4.2 5.9 -0.4 5.4<br />
Germany 4.9 2.0 1.0 0.3 0.5 -0.7 -0.1 1.6<br />
Netherlands 1.0 3.6 -1.4 -1.6 -0.1 1.9 2.3 2.0<br />
Poland -0.5 -10.7 -0.3 -0.9 -0.5 -0.4 0.0 -0.1<br />
Portugal 2.2 4.6 3.6 2.5 1.8 0.9 1.4 0.4<br />
Romania -0.9 -0.2 -0.3 -0.3 0.0 0.1 -0.1 0.0<br />
Slovakia 0.5 -4.1 0.6 0.7 1.3 1.3 0.8 0.6<br />
Slovenia 0.4 1.4 3.2 3.1 7.1 9.2 5.6 -0.3<br />
Spain 1.8 9.7 14.8 13.7 15.6 9.0 1.1 1.3<br />
Sweden 1.3 2.7 3.0 5.6 5.9 6 6.7 5.3<br />
United Kingdom 1.1 2.4 3.8 3.2 3.5 3.1 3.3 2.6<br />
Source: Eurostat Portal Page – Population and social conditions – Population, 2011.<br />
Figure: Work permits issued for foreigners in Slovenia, by sector, 2010 and 2011<br />
F Construction<br />
C Manufacturing<br />
H Transportation<br />
and storage<br />
I Accommodation<br />
and food …<br />
G Wholesale,retail;<br />
repair of …<br />
2011 2010<br />
Other activities<br />
Activity unknown<br />
0 5 10 15 20 25 30 35<br />
No. of work permits in 1,000<br />
Source: SRE, Labour market in figures, 2011, available at http://www.ess.gov.


