

development report 2012 - UMAR
development report 2012 - UMAR
development report 2012 - UMAR

Create successful ePaper yourself
Turn your PDF publications into a flip-book with our unique Google optimized e-Paper software.
48 Development Report <strong>2012</strong><br />
Development by the priorities of SDS – An efficient and less costly state<br />
In 2008–2011, compensation of employees, which in<br />
terms of general government expenditure accounts<br />
for over 12% of GDP, increased despite restrictions.<br />
After several years of steady growth, compensation<br />
of employees reached its lowest level in 2007 (10.5%<br />
of GDP). Following the partial realisation of the 2008<br />
wage reform, compensation increased by 0.5 p.p. and by<br />
another 1.5 p.p. of GDP in 2009. The increase was partly<br />
due to a fall in GDP. Despite the adoption of measures<br />
to freeze wages in 2010, compensations of employees<br />
rose by 2.3% in nominal terms (0.2% of GDP), and, at<br />
employment growth of 0.4% in 2011, it stayed at the<br />
relative level of 2010. In terms of individual functions,<br />
their growth in 2010 121 varied. The growth was very<br />
slow in defence, health and general public services;<br />
a considerable increase was recorded in research<br />
activities, recreation, culture and social protection, while<br />
the increase was slightly lower in education, public order<br />
and safety. The increase in compensation of employees<br />
was also on account of growing employment which<br />
in general government expenditure 122 rose by 1.5% in<br />
2010 compared to 2009 and by 3% since 2008. In 2009,<br />
Slovenia’s compensation of employees, expressed as<br />
a share of GDP, was substantially higher than in the EU<br />
(Slovenia: 12.5% of GDP; EU: 11.3% of GDP); before wage<br />
reform (2007), it was almost at the same level. A higher<br />
Slovenia’s share of expenditure than the EU average<br />
results from a slightly higher share of employment in the<br />
general government sector.<br />
Nearly one third of compensation of employees in 2010<br />
is accounted for in education and a good fifth in health,<br />
and by a tenth in the areas of public administration,<br />
public order and safety. Compensation of employees in<br />
education sharply rose in nominal and real terms until<br />
2006, while in subsequent years it gradually decreased<br />
their share in the structure of total expenditure. In 2010,<br />
the downward trend stopped; as the employment<br />
increased, their structural share again slightly increased.<br />
In health, compensation of employees diminished their<br />
structural share in the period until 2007. On account of<br />
wage reform, they increased more than with respect to<br />
other functions, which caused their dramatic increase in<br />
2008 and 2009. In 2010, the compensations remained at<br />
the 2009 year’s level, their share in the structure of total<br />
expenditure on compensation of employees decreased.<br />
Compensation for public administration employees<br />
has been particularly limited in the last two years and,<br />
as a result, their structural share has been in a severe<br />
downturn since 2007. Compensation of employees in<br />
the area of public order and safety has slightly increased<br />
in the past two years, but have decreased in the area of<br />
defence. The share of other compensation recipients is<br />
smaller and their growth varies. Structural shares rose<br />
in social protection and recreation, culture and religion,<br />
and research activities. The personnel expenditure<br />
structure in Slovenia differs substantially from that in the<br />
EU 123 , which also depends on the way in which activities<br />
between the public and private sectors are financed 124 .<br />
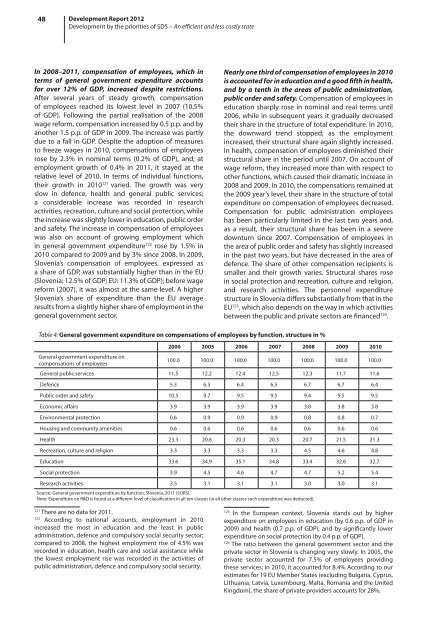
Table 4: General government expenditure on compensations of employees by function, structure in %<br />
2000 2005 2006 2007 2008 2009 2010<br />
General government expenditure on<br />
compensations of employees<br />
100.0 100.0 100.0 100.0 100.0 100.0 100.0<br />
General public services 11.5 12.2 12.4 12.5 12.3 11.7 11.6<br />
Defence 5.3 6.3 6.4 6.5 6.7 6.7 6.4<br />
Public order and safety 10.5 9.7 9.5 9.5 9.4 9.5 9.5<br />
Economic affairs 3.9 3.9 3.9 3.9 3.8 3.8 3.8<br />
Environmental protection 0.6 0.9 0.9 0.9 0.8 0.8 0.7<br />
Housing and community amenities 0.6 0.6 0.6 0.6 0.6 0.6 0.6<br />
Health 23.3 20.6 20.3 20.3 20.7 21.5 21.3<br />
Recreation, culture and religion 3.3 3.3 3.3 3.3 4.5 4.6 4.8<br />
Education 33.6 34.9 35.1 34.8 33.4 32.6 32.7<br />
Social protection 3.9 4.5 4.6 4.7 4.7 5.2 5.4<br />
Research activities 3.5 3.1 3.1 3.1 3.0 3.0 3.1<br />
Source: General government expenditure by function, Slovenia, 2011 (SORS).<br />
Note: Expenditure on R&D is found at a different level of classification in all ten classes (in all other classes such expenditure was deducted).<br />
121<br />
There are no data for 2011.<br />
122<br />
According to national accounts, employment in 2010<br />
increased the most in education and the least in public<br />
administration, defence and compulsory social security sector;<br />
compared to 2008, the highest employment rise of 4.5% was<br />
recorded in education, health care and social assistance while<br />
the lowest employment rise was recorded in the activities of<br />
public administration, defence and compulsory social security.<br />
123<br />
In the European context, Slovenia stands out by higher<br />
expenditure on employees in education (by 0.6 p.p. of GDP in<br />
2009) and health (0.7 p.p. of GDP), and by significantly lower<br />
expenditure on social protection (by 0.4 p.p. of GDP).<br />
124<br />
The ratio between the general government sector and the<br />
private sector in Slovenia is changing very slowly. In 2005, the<br />
private sector accounted for 7.5% of employees providing<br />
these services; in 2010, it accounted for 8.4% According to our<br />
estimates for 19 EU Member States (excluding Bulgaria, Cyprus,<br />
Lithuania, Latvia, Luxembourg, Malta, Romania and the United<br />
Kingdom), the share of private providers accounts for 28%.


