Company Valuation Under IFRS : Interpreting and Forecasting ...
Company Valuation Under IFRS : Interpreting and Forecasting ...
Company Valuation Under IFRS : Interpreting and Forecasting ...

You also want an ePaper? Increase the reach of your titles
YUMPU automatically turns print PDFs into web optimized ePapers that Google loves.
<strong>Company</strong> valuation under <strong>IFRS</strong><br />
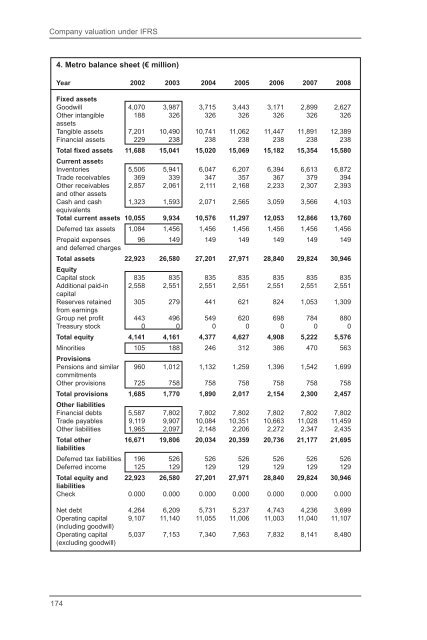
4. Metro balance sheet (€ million)<br />
Year 2002 2003 2004 2005 2006 2007 2008<br />
Fixed assets<br />
Goodwill 4,070 3,987 3,715 3,443 3,171 2,899 2,627<br />
Other intangible 188 326 326 326 326 326 326<br />
assets<br />
Tangible assets 7,201 10,490 10,741 11,062 11,447 11,891 12,389<br />
Financial assets 229 238 238 238 238 238 238<br />
Total fixed assets 11,688 15,041 15,020 15,069 15,182 15,354 15,580<br />
Current assets<br />
Inventories 5,506 5,941 6,047 6,207 6,394 6,613 6,872<br />
Trade receivables 369 339 347 357 367 379 394<br />
Other receivables 2,857 2,061 2,111 2,168 2,233 2,307 2,393<br />
<strong>and</strong> other assets<br />
Cash <strong>and</strong> cash 1,323 1,593 2,071 2,565 3,059 3,566 4,103<br />
equivalents<br />
Total current assets 10,055 9,934 10,576 11,297 12,053 12,866 13,760<br />
Deferred tax assets 1,084 1,456 1,456 1,456 1,456 1,456 1,456<br />
Prepaid expenses 96 149 149 149 149 149 149<br />
<strong>and</strong> deferred charges<br />
Total assets 22,923 26,580 27,201 27,971 28,840 29,824 30,946<br />
Equity<br />
Capital stock 835 835 835 835 835 835 835<br />
Additional paid-in 2,558 2,551 2,551 2,551 2,551 2,551 2,551<br />
capital<br />
Reserves retained 305 279 441 621 824 1,053 1,309<br />
from earnings<br />
Group net profit 443 496 549 620 698 784 880<br />
Treasury stock 0 0 0 0 0 0 0<br />
Total equity 4,141 4,161 4,377 4,627 4,908 5,222 5,576<br />
Minorities 105 188 246 312 386 470 563<br />
Provisions<br />
Pensions <strong>and</strong> similar 960 1,012 1,132 1,259 1,396 1,542 1,699<br />
commitments<br />
Other provisions 725 758 758 758 758 758 758<br />
Total provisions 1,685 1,770 1,890 2,017 2,154 2,300 2,457<br />
Other liabilities<br />
Financial debts 5,587 7,802 7,802 7,802 7,802 7,802 7,802<br />
Trade payables 9,119 9,907 10,084 10,351 10,663 11,028 11,459<br />
Other liabilities 1,965 2,097 2,148 2,206 2,272 2,347 2,435<br />
Total other 16,671 19,806 20,034 20,359 20,736 21,177 21,695<br />
liabilities<br />
Deferred tax liabilities 196 526 526 526 526 526 526<br />
Deferred income 125 129 129 129 129 129 129<br />
Total equity <strong>and</strong> 22,923 26,580 27,201 27,971 28,840 29,824 30,946<br />
liabilities<br />
Check 0.000 0.000 0.000 0.000 0.000 0.000 0.000<br />
Net debt 4,264 6,209 5,731 5,237 4,743 4,236 3,699<br />
Operating capital 9,107 11,140 11,055 11,006 11,003 11,040 11,107<br />
(including goodwill)<br />
Operating capital 5,037 7,153 7,340 7,563 7,832 8,141 8,480<br />
(excluding goodwill)<br />
174