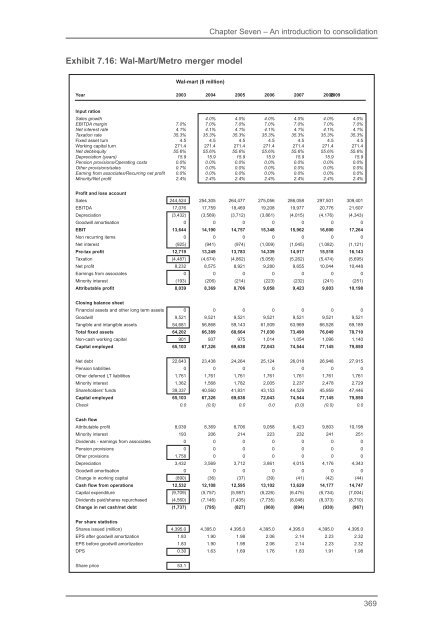
Chapter Seven – An introduction to consolidation Exhibit 7.16: Wal-Mart/Metro merger model Wal-mart ($ million) Year 2003 2004 2005 2006 2007 20082009 Input ratios Sales growth 4.0% 4.0% 4.0% 4.0% 4.0% 4.0% EBITDA margin 7.0% 7.0% 7.0% 7.0% 7.0% 7.0% 7.0% Net interest rate 4.1% 4.1% 4.1% 4.1% 4.1% 4.1% 4.1% Taxation rate 35.3% 35.3% 35.3% 35.3% 35.3% 35.3% 35.3% Fixed asset turn 4.5 4.5 4.5 4.5 4.5 4.5 4.5 Working capital turn 271.4 271.4 271.4 271.4 271.4 271.4 271.4 Net debt/equity 55.6% 55.6% 55.6% 55.6% 55.6% 55.6% 55.6% Depreciation (years) 15.9 15.9 15.9 15.9 15.9 15.9 15.9 Pension provisions/Operating costs 0.0% 0.0% 0.0% 0.0% 0.0% 0.0% 0.0% Other provisions/sales 0.7% 0.0% 0.0% 0.0% 0.0% 0.0% 0.0% Earning from associates/Recurring net profit 0.0% 0.0% 0.0% 0.0% 0.0% 0.0% 0.0% Minority/Net profit 2.4% 2.4% 2.4% 2.4% 2.4% 2.4% 2.4% Profit <strong>and</strong> loss account Sales 244,524 254,305 264,477 275,056 286,058 297,501 309,401 EBITDA 17,076 17,759 18,469 19,208 19,977 20,776 21,607 Depreciation (3,432) (3,569) (3,712) (3,861) (4,015) (4,176) (4,343) Goodwill amortisation 0 0 0 0 0 0 0 EBIT 13,644 14,190 14,757 15,348 15,962 16,600 17,264 Non recurring items 0 0 0 0 0 0 0 Net interest (925) (941) (974) (1,009) (1,045) (1,082) (1,121) Pre-tax profit 12,719 13,249 13,783 14,339 14,917 15,518 16,143 Taxation (4,487) (4,674) (4,862) (5,058) (5,262) (5,474) (5,695) Net profit 8,232 8,575 8,921 9,280 9,655 10,044 10,448 Earnings from associates 0 0 0 0 0 0 0 Minority interest (193) (206) (214) (223) (232) (241) (251) Attributable profit 8,039 8,369 8,706 9,058 9,423 9,803 10,198 Closing balance sheet Financial assets <strong>and</strong> other long term assets 0 0 0 0 0 0 0 Goodwill 9,521 9,521 9,521 9,521 9,521 9,521 9,521 Tangible <strong>and</strong> intangible assets 54,681 56,868 59,143 61,509 63,969 66,528 69,189 Total fixed assets 64,202 66,389 68,664 71,030 73,490 76,049 78,710 Non-cash working capital 901 937 975 1,014 1,054 1,096 1,140 Capital employed 65,103 67,326 69,638 72,043 74,544 77,145 79,850 Net debt 22,643 23,438 24,264 25,124 26,018 26,948 27,915 Pension liabilities 0 0 0 0 0 0 0 Other deferred LT liabilities 1,761 1,761 1,761 1,761 1,761 1,761 1,761 Minority interest 1,362 1,568 1,782 2,005 2,237 2,478 2,729 Shareholders' funds 39,337 40,560 41,831 43,153 44,529 45,959 47,446 Capital employed 65,103 67,326 69,638 72,043 74,544 77,145 79,850 Check 0.0 (0.0) 0.0 0.0 (0.0) (0.0) 0.0 Cash flow Attributable profit 8,039 8,369 8,706 9,058 9,423 9,803 10,198 Minority interest 193 206 214 223 232 241 251 Dividends - earnings from associates 0 0 0 0 0 0 0 Pension provisions 0 0 0 0 0 0 0 Other provisions 1,758 0 0 0 0 0 0 Depreciation 3,432 3,569 3,712 3,861 4,015 4,176 4,343 Goodwill amortisation 0 0 0 0 0 0 0 Change in working capital (890) (36) (37) (39) (41) (42) (44) Cash flow from operations 12,532 12,108 12,595 13,102 13,629 14,177 14,747 Capital expenditure (9,709) (5,757) (5,987) (6,226) (6,475) (6,734) (7,004) Dividends paid/shares repurchased (4,560) (7,146) (7,435) (7,735) (8,048) (8,373) (8,710) Change in net cash/net debt (1,737) (795) (827) (860) (894) (930) (967) Per share statistics Shares issued (million) 4,395.0 4,395.0 4,395.0 4,395.0 4,395.0 4,395.0 4,395.0 EPS after goodwill amortization 1.83 1.90 1.98 2.06 2.14 2.23 2.32 EPS before goodwill amortization 1.83 1.90 1.98 2.06 2.14 2.23 2.32 DPS 0.30 1.63 1.69 1.76 1.83 1.91 1.98 Share price 53.1 369
<strong>Company</strong> valuation under <strong>IFRS</strong> Metro ($ million at Euro 1.00 = $1.2395) Year 2003 2004 2005 2006 2007 20082009 Input ratios Sales growth 2.4% 2.7% 3.0% 3.3% 3.7% 3.7% EBITDA margin 5.4% 6.2% 6.2% 6.3% 6.3% 6.4% 6.4% Net interest rate 8.1% 8.0% 7.2% 6.4% 6.4% 6.4% 6.4% Taxation rate 22.6% 34.6% 34.6% 34.6% 34.7% 34.7% 34.7% Fixed asset turn 4.3 4.5 4.4 4.4 4.3 4.3 4.2 Working capital turn (14.6) (15.4) (15.4) (15.4) (15.4) (15.4) (15.4) Net debt/equity 142.8% 142.8% 142.8% 142.8% 142.8% 142.8% 142.8% Depreciation (years) 9.6 8.0 8.2 8.4 8.5 8.7 8.7 Pension provisions/Operating costs (0.0%) 0.1% 0.1% 0.1% 0.1% 0.1% 0.1% Other provisions/sales 0.8% 0.0% 0.0% 0.0% 0.0% 0.0% 0.0% Earning from associates/Recurring net profit 0.0% 0.0% 0.0% 0.0% 0.0% 0.0% 0.0% Minority/Net profit 11.5% 12.8% 14.3% 16.0% 17.8% 19.8% 22.1% Profit <strong>and</strong> loss account Sales 66,431 68,049 69,880 71,965 74,357 77,123 79,992 EBITDA 3,578 4,222 4,358 4,515 4,697 4,906 5,089 Depreciation (1,608) (1,885) (1,923) (1,967) (2,018) (2,074) (2,179) Goodwill amortisation (337) (337) (337) (337) (337) (337) (337) EBIT 1,634 1,999 2,098 2,211 2,342 2,495 2,573 Non recurring items 0 0 0 0 0 0 0 Net interest (621) (591) (534) (477) (489) (501) (506) Pre-tax profit 1,013 1,408 1,564 1,734 1,853 1,994 2,067 Taxation (305) (604) (658) (718) (759) (808) (834) Net profit 708 805 906 1,017 1,094 1,185 1,233 Earnings from associates 0 0 0 0 0 0 0 Minority interest (73) (73) (73) (73) (73) (73) (73) Attributable profit 635 732 833 944 1,021 1,112 1,160 Closing balance sheet Financial assets 295 295 295 295 295 295 295 Goodwill 4,942 4,605 4,268 3,930 3,593 3,256 2,919 Tangible <strong>and</strong> intangibles 15,396 15,159 15,765 16,442 17,204 18,071 18,982 Total fixed assets 20,633 20,059 20,328 20,667 21,093 21,622 22,196 Non-cash working capital (4,540) (4,414) (4,533) (4,669) (4,824) (5,003) (5,189) Capital employed 16,092 15,645 15,795 15,999 16,269 16,619 17,006 Net debt 7,696 7,389 7,433 7,507 7,619 7,777 7,943 Pension liabilities 1,254 1,328 1,404 1,482 1,562 1,643 1,748 Other deferred LT liabilities 1,751 1,751 1,751 1,751 1,751 1,751 1,751 Minority interest 233 306 379 452 526 599 672 Shareholders' funds 5,158 4,870 4,827 4,806 4,811 4,849 4,892 Capital employed 16,092 15,645 15,795 15,999 16,269 16,619 17,006 Check 0.0 (0.0) 0.0 (0.0) (0.0) (0.0) (0.0) Cash flow Attributable profit 635 732 833 944 1,021 1,112 1,160 Minority interest 73 73 73 73 73 73 73 Dividends - earnings from associates 0 0 0 0 0 0 0 Pension provisions (7) 74 76 78 80 82 105 Other provisions 500 0 0 0 0 0 0 Depreciation 1,608 1,885 1,923 1,967 2,018 2,074 2,179 Goodwill amortisation 337 337 337 337 337 337 337 Change in working capital 409 (126) 119 135 155 179 186 Cash flow from operations 3,554 2,976 3,361 3,534 3,683 3,858 4,040 Capital expenditure (1,512) (1,649) (2,529) (2,644) (2,780) (2,941) (3,089) Dividends paid (523) (1,020) (876) (965) (1,015) (1,075) (1,117) Change in net cash/net debt 1,518 307 (43) (74) (112) (158) (166) Per share statistics Shares issued (million) 326.8 326.8 326.8 326.8 313.2 299.6 299.6 EPS after goodwill amortization 1.94 2.24 2.55 2.89 3.26 3.71 3.87 EPS before goodwill amortization 2.97 3.27 3.58 3.92 4.34 4.84 5.00 DPS 1.60 3.12 2.68 2.95 3.24 3.59 3.73 Share price 45.6 370
- Page 1 and 2:
Company valuation IFRS under Interp
- Page 3 and 4:
HARRIMAN HOUSE LTD 3A Penns Road Pe
- Page 6 and 7:
Contents Index of exhibits About th
- Page 8 and 9:
Index of exhibits Chapter One 1.1 C
- Page 10 and 11:
Index of exhibits 4.28 Capitalising
- Page 12:
About the authors Nick Antill: Sinc
- Page 15 and 16:
Company valuation under IFRS Most q
- Page 17 and 18:
Company valuation under IFRS Chapte
- Page 20:
Acknowledgments The authors have be
- Page 23 and 24:
Company valuation under IFRS Are th
- Page 25 and 26:
Company valuation under IFRS In add
- Page 27 and 28:
Company valuation under IFRS The sa
- Page 29 and 30:
Company valuation under IFRS Furthe
- Page 31 and 32:
Company valuation under IFRS Our pr
- Page 33 and 34:
Company valuation under IFRS Sadly,
- Page 35 and 36:
Company valuation under IFRS Exhibi
- Page 37 and 38:
Company valuation under IFRS Exhibi
- Page 39 and 40:
Company valuation under IFRS would
- Page 41 and 42:
Company valuation under IFRS the ea
- Page 43 and 44:
Company valuation under IFRS One ad
- Page 45 and 46:
Company valuation under IFRS To spe
- Page 47 and 48:
Company valuation under IFRS Exhibi
- Page 49 and 50:
Company valuation under IFRS 2. Div
- Page 51 and 52:
Company valuation under IFRS This w
- Page 53 and 54:
Company valuation under IFRS portfo
- Page 55 and 56:
Company valuation under IFRS portfo
- Page 57 and 58:
Company valuation under IFRS Exhibi
- Page 59 and 60:
Company valuation under IFRS premiu
- Page 61 and 62:
Company valuation under IFRS Exhibi
- Page 63 and 64:
Company valuation under IFRS K E =R
- Page 65 and 66:
Company valuation under IFRS 5. Bui
- Page 67 and 68:
Company valuation under IFRS Exhibi
- Page 69 and 70:
Company valuation under IFRS depend
- Page 71 and 72:
Company valuation under IFRS The ta
- Page 73 and 74:
Company valuation under IFRS 1. We
- Page 75 and 76:
Company valuation under IFRS The AP
- Page 77 and 78:
Company valuation under IFRS averag
- Page 79 and 80:
Company valuation under IFRS 6. Tim
- Page 81 and 82:
Company valuation under IFRS Exhibi
- Page 83 and 84:
Company valuation under IFRS Exhibi
- Page 85 and 86:
Company valuation under IFRS Exhibi
- Page 87 and 88:
Company valuation under IFRS 2. Est
- Page 89 and 90:
Company valuation under IFRS Equity
- Page 91 and 92:
Company valuation under IFRS Exhibi
- Page 93 and 94:
Company valuation under IFRS 8. Int
- Page 95 and 96:
Company valuation under IFRS 7. Is
- Page 97 and 98:
Company valuation under IFRS 1. IRR
- Page 99 and 100:
Company valuation under IFRS The fi
- Page 101 and 102:
Company valuation under IFRS underg
- Page 103 and 104:
Company valuation under IFRS Exhibi
- Page 105 and 106:
Company valuation under IFRS In thi
- Page 107 and 108:
Company valuation under IFRS 3. For
- Page 109 and 110:
Company valuation under IFRS Chart
- Page 111 and 112:
Company valuation under IFRS Someth
- Page 113 and 114:
Company valuation under IFRS Notwit
- Page 115 and 116:
Company valuation under IFRS produc
- Page 117 and 118:
Company valuation under IFRS perfor
- Page 119 and 120:
Company valuation under IFRS 1.3 US
- Page 121 and 122:
Company valuation under IFRS guaran
- Page 123 and 124:
Company valuation under IFRS 1.5 Ca
- Page 125 and 126:
Company valuation under IFRS These
- Page 127 and 128:
Company valuation under IFRS • Th
- Page 129 and 130:
Company valuation under IFRS The ot
- Page 131 and 132:
Company valuation under IFRS The mo
- Page 133 and 134:
Company valuation under IFRS Once c
- Page 135 and 136:
Company valuation under IFRS The va
- Page 137 and 138:
Company valuation under IFRS 3.3 US
- Page 139 and 140:
Company valuation under IFRS Exhibi
- Page 141 and 142:
Company valuation under IFRS The pr
- Page 143 and 144:
Company valuation under IFRS 4.2 Wh
- Page 145 and 146:
Company valuation under IFRS The ca
- Page 147 and 148:
Company valuation under IFRS Gains
- Page 149 and 150:
Company valuation under IFRS Soluti
- Page 151 and 152:
Company valuation under IFRS Exhibi
- Page 153 and 154:
Company valuation under IFRS • IA
- Page 155 and 156:
Company valuation under IFRS Exampl
- Page 157 and 158:
Company valuation under IFRS 5.3 US
- Page 159 and 160:
Company valuation under IFRS 5.5 Im
- Page 161 and 162:
Company valuation under IFRS Exhibi
- Page 163 and 164:
Company valuation under IFRS Exhibi
- Page 165 and 166:
Company valuation under IFRS 6.4 Ca
- Page 167 and 168:
Company valuation under IFRS physic
- Page 169 and 170:
Company valuation under IFRS • Re
- Page 171 and 172:
Company valuation under IFRS 1. For
- Page 173 and 174:
Company valuation under IFRS Exampl
- Page 175 and 176:
Company valuation under IFRS Deriva
- Page 177 and 178:
Company valuation under IFRS 2. It
- Page 179 and 180:
Company valuation under IFRS Most a
- Page 181 and 182:
Company valuation under IFRS The di
- Page 183 and 184:
Company valuation under IFRS 8.4 Ca
- Page 185 and 186:
Company valuation under IFRS 8.5 Im
- Page 187 and 188:
Company valuation under IFRS 9.2 Wh
- Page 189 and 190:
Company valuation under IFRS In man
- Page 191 and 192:
Company valuation under IFRS balanc
- Page 194 and 195:
Chapter Five Valuing a company Pull
- Page 196 and 197:
Chapter Five - Valuing a company Ex
- Page 198 and 199:
Chapter Five - Valuing a company 3.
- Page 200 and 201:
Chapter Five - Valuing a company 5.
- Page 202 and 203:
Chapter Five - Valuing a company 9.
- Page 204 and 205:
Chapter Five - Valuing a company an
- Page 206 and 207:
Chapter Five - Valuing a company gu
- Page 208 and 209:
Chapter Five - Valuing a company 1.
- Page 210 and 211:
Chapter Five - Valuing a company To
- Page 212 and 213:
Chapter Five - Valuing a company Be
- Page 214 and 215:
Chapter Five - Valuing a company fl
- Page 216 and 217:
Chapter Five - Valuing a company As
- Page 218 and 219:
Chapter Five - Valuing a company 1.
- Page 220 and 221:
Chapter Five - Valuing a company Ho
- Page 222 and 223:
Chapter Five - Valuing a company sh
- Page 224 and 225:
Chapter Five - Valuing a company we
- Page 226 and 227:
Chapter Five - Valuing a company is
- Page 228 and 229:
Chapter Five - Valuing a company 12
- Page 230 and 231:
Chapter Five - Valuing a company 3.
- Page 232 and 233:
Chapter Five - Valuing a company ve
- Page 234 and 235:
Chapter Five - Valuing a company wh
- Page 236 and 237:
Chapter Five - Valuing a company ge
- Page 238 and 239:
Chapter Five - Valuing a company in
- Page 240 and 241:
Chapter Five - Valuing a company 4.
- Page 242 and 243:
Chapter Five - Valuing a company 13
- Page 244 and 245:
Chapter Five - Valuing a company (S
- Page 246 and 247:
Chapter Five - Valuing a company Ra
- Page 248 and 249:
Chapter Five - Valuing a company Ex
- Page 250 and 251:
Chapter Five - Valuing a company Ex
- Page 252 and 253:
Chapter Five - Valuing a company ca
- Page 254 and 255:
Chapter Five - Valuing a company Th
- Page 256 and 257:
Chapter Five - Valuing a company Pe
- Page 258 and 259:
Chapter Five - Valuing a company Ba
- Page 260 and 261:
Chapter Five - Valuing a company Sh
- Page 262 and 263:
Chapter Five - Valuing a company Th
- Page 264 and 265:
Chapter Five - Valuing a company 5.
- Page 266 and 267:
Chapter Five - Valuing a company gr
- Page 268:
Chapter Five - Valuing a company fo
- Page 271 and 272:
Company valuation under IFRS • Th
- Page 273 and 274:
Company valuation under IFRS explic
- Page 275 and 276:
Company valuation under IFRS 2. CCA
- Page 277 and 278:
Company valuation under IFRS 5. Nom
- Page 279 and 280:
Company valuation under IFRS The fi
- Page 281 and 282:
Company valuation under IFRS IRR of
- Page 283 and 284:
Company valuation under IFRS 1.4.7
- Page 285 and 286:
Company valuation under IFRS knew t
- Page 287 and 288:
Company valuation under IFRS to tra
- Page 289 and 290:
Company valuation under IFRS of it
- Page 291 and 292:
Company valuation under IFRS This a
- Page 293 and 294:
Company valuation under IFRS 4. ROC
- Page 295 and 296:
Company valuation under IFRS Costs
- Page 297 and 298:
Company valuation under IFRS 2. The
- Page 299 and 300:
Company valuation under IFRS 3.1.1
- Page 301 and 302:
Company valuation under IFRS 1. The
- Page 303 and 304:
Company valuation under IFRS Securi
- Page 305 and 306:
Company valuation under IFRS Regula
- Page 307 and 308:
Company valuation under IFRS Perpet
- Page 309 and 310:
Company valuation under IFRS Tier 3
- Page 311 and 312:
Company valuation under IFRS Exhibi
- Page 313 and 314:
Company valuation under IFRS flow t
- Page 315 and 316:
Company valuation under IFRS Exhibi
- Page 317 and 318:
Company valuation under IFRS 3. Com
- Page 319 and 320:
Company valuation under IFRS 7. Com
- Page 321 and 322:
Company valuation under IFRS Turnin
- Page 323 and 324:
Company valuation under IFRS 3.6.9
- Page 325 and 326:
Company valuation under IFRS costs
- Page 327 and 328:
Company valuation under IFRS Exhibi
- Page 329 and 330:
Company valuation under IFRS 2. If
- Page 331 and 332:
Company valuation under IFRS The ma
- Page 333 and 334:
Company valuation under IFRS 4.2 Re
- Page 335 and 336:
Company valuation under IFRS • Pr
- Page 337 and 338:
Company valuation under IFRS The re
- Page 339 and 340:
Company valuation under IFRS 3. Sun
- Page 341 and 342:
Company valuation under IFRS 5. Sun
- Page 343 and 344: Company valuation under IFRS 7. Sun
- Page 345 and 346: Company valuation under IFRS 10. Su
- Page 347 and 348: Company valuation under IFRS How ca
- Page 349 and 350: Company valuation under IFRS techni
- Page 351 and 352: Company valuation under IFRS Exhibi
- Page 353 and 354: Company valuation under IFRS Under
- Page 355 and 356: Company valuation under IFRS assump
- Page 357 and 358: Company valuation under IFRS 4. Leg
- Page 359 and 360: Company valuation under IFRS busine
- Page 361 and 362: Company valuation under IFRS Model
- Page 363 and 364: Company valuation under IFRS capita
- Page 365 and 366: Company valuation under IFRS to fad
- Page 368 and 369: Chapter Seven An introduction to co
- Page 370 and 371: Chapter Seven - An introduction to
- Page 372 and 373: Chapter Seven - An introduction to
- Page 374 and 375: Chapter Seven - An introduction to
- Page 376 and 377: Chapter Seven - An introduction to
- Page 378 and 379: Chapter Seven - An introduction to
- Page 380 and 381: Chapter Seven - An introduction to
- Page 382 and 383: Chapter Seven - An introduction to
- Page 384 and 385: Chapter Seven - An introduction to
- Page 386 and 387: Chapter Seven - An introduction to
- Page 388 and 389: Chapter Seven - An introduction to
- Page 390 and 391: Chapter Seven - An introduction to
- Page 392 and 393: Chapter Seven - An introduction to
- Page 396 and 397: Chapter Seven - An introduction to
- Page 398 and 399: Chapter Seven - An introduction to
- Page 400 and 401: Chapter Seven - An introduction to
- Page 402 and 403: Chapter Seven - An introduction to
- Page 404 and 405: Chapter Eight Conclusions and conti
- Page 406 and 407: Chapter Eight - Conclusions and con
- Page 408 and 409: Chapter Eight - Conclusions and con
- Page 410 and 411: Further reading Introduction This b
- Page 412: Further reading Difficult sectors T
- Page 415 and 416: Company valuation under IFRS IAS 26
- Page 417 and 418: Company valuation under IFRS Jurisd
- Page 419 and 420: Company valuation under IFRS Analys
- Page 421 and 422: Company valuation under IFRS 5. Lev
- Page 424 and 425: Index A Accrual 14-15, 90, 99, 106,
- Page 426 and 427: Index E Earned premiums 301-303, 32
- Page 428 and 429: Index J Joint venture 354 L Leases
- Page 430 and 431: Index Regulatory capital 274, 281,