Annual report 2006 - Dexia.com
Annual report 2006 - Dexia.com
Annual report 2006 - Dexia.com

You also want an ePaper? Increase the reach of your titles
YUMPU automatically turns print PDFs into web optimized ePapers that Google loves.
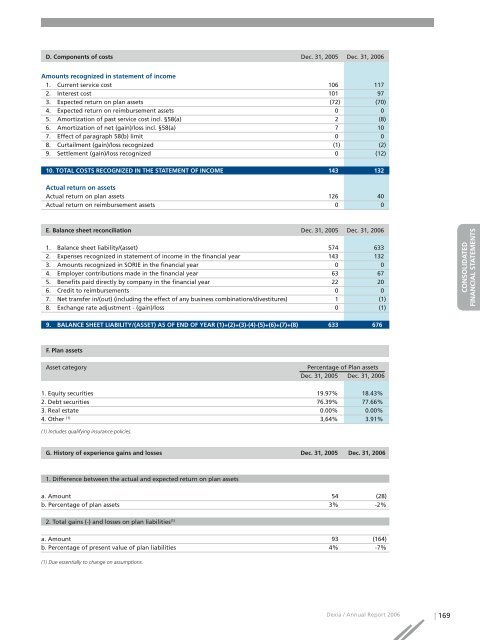
D. Components of costs Dec. 31, 2005 Dec. 31, <strong>2006</strong><br />
Amounts recognized in statement of in<strong>com</strong>e<br />
1. Current service cost 106 117<br />
2. Interest cost 101 97<br />
3. Expected return on plan assets (72) (70)<br />
4. Expected return on reimbursement assets 0 0<br />
5. Amortization of past service cost incl. §58(a) 2 (8)<br />
6. Amortization of net (gain)/loss incl. §58(a) 7 10<br />
7. Effect of paragraph 58(b) limit 0 0<br />
8. Curtailment (gain)/loss recognized (1) (2)<br />
9. Settlement (gain)/loss recognized 0 (12)<br />
10. TOTAL COSTS RECOGNIZED IN THE STATEMENT OF INCOME 143 132<br />
Actual return on assets<br />
Actual return on plan assets 126 40<br />
Actual return on reimbursement assets 0 0<br />
RAPPORT DE GESTION<br />
E. Balance sheet reconciliation Dec. 31, 2005 Dec. 31, <strong>2006</strong><br />
1. Balance sheet liability/(asset) 574 633<br />
2. Expenses recognized in statement of in<strong>com</strong>e in the financial year 143 132<br />
3. Amounts recognized in SORIE in the financial year 0 0<br />
4. Employer contributions made in the financial year 63 67<br />
5. Benefits paid directly by <strong>com</strong>pany in the financial year 22 20<br />
6. Credit to reimbursements 0 0<br />
7. Net transfer in/(out) (including the effect of any business <strong>com</strong>binations/divestitures) 1 (1)<br />
8. Exchange rate adjustment - (gain)/loss 0 (1)<br />
9. BALANCE SHEET LIABILITY/(ASSET) AS OF END OF YEAR (1)+(2)+(3)-(4)-(5)+(6)+(7)+(8) 633 676<br />
F. Plan assets<br />
Asset category<br />
Percentage of Plan assets<br />
Dec. 31, 2005 Dec. 31, <strong>2006</strong><br />
CONSOLIDATED<br />
FINANCIAL STATEMENTS<br />
COMPTES SOCIAUX<br />
1. Equity securities 19.97% 18.43%<br />
2. Debt securities 76.39% 77.66%<br />
3. Real estate 0.00% 0.00%<br />
4. Other (1) 3,64% 3.91%<br />
(1) Includes qualifying insurance policies.<br />
G. History of experience gains and losses Dec. 31, 2005 Dec. 31, <strong>2006</strong><br />
1. Difference between the actual and expected return on plan assets<br />
a. Amount 54 (28)<br />
b. Percentage of plan assets 3% -2%<br />
2. Total gains (-) and losses on plan liabilities (1)<br />
a. Amount 93 (164)<br />
b. Percentage of present value of plan liabilities 4% -7%<br />
(1) Due essentially to change on assumptions.<br />
<strong>Dexia</strong> / <strong>Annual</strong> Report <strong>2006</strong> | 169