Annual report 2006 - Dexia.com
Annual report 2006 - Dexia.com
Annual report 2006 - Dexia.com

Create successful ePaper yourself
Turn your PDF publications into a flip-book with our unique Google optimized e-Paper software.
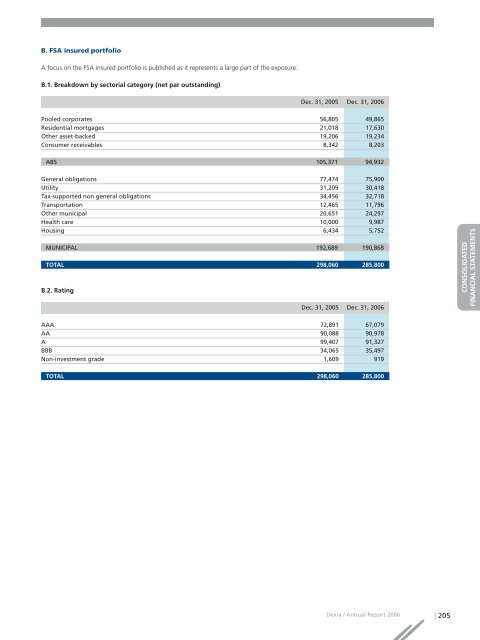
B. FSA insured portfolio<br />
A focus on the FSA insured portfolio is published as it represents a large part of the exposure.<br />
B.1. Breakdown by sectorial category (net par outstanding)<br />
Dec. 31, 2005 Dec. 31, <strong>2006</strong><br />
Pooled corporates 56,805 49,865<br />
Residential mortgages 21,018 17,630<br />
Other asset-backed 19,206 19,234<br />
Consumer receivables 8,342 8,203<br />
ABS 105,371 94,932<br />
General obligations 77,474 75,900<br />
Utility 31,209 30,418<br />
Tax-supported non general obligations 34,456 32,718<br />
Transportation 12,465 11,796<br />
Other municipal 20,651 24,297<br />
Health care 10,000 9,987<br />
Housing 6,434 5,752<br />
MUNICIPAL 192,689 190,868<br />
TOTAL 298,060 285,800<br />
B.2. Rating<br />
Dec. 31, 2005 Dec. 31, <strong>2006</strong><br />
AAA 72,891 67,079<br />
AA 90,088 90,978<br />
A 99,407 91,327<br />
BBB 34,065 35,497<br />
Non-investment grade 1,609 919<br />
TOTAL 298,060 285,800<br />
RAPPORT DE GESTION<br />
CONSOLIDATED<br />
FINANCIAL STATEMENTS<br />
COMPTES SOCIAUX<br />
<strong>Dexia</strong> / <strong>Annual</strong> Report <strong>2006</strong> | 205