Annual report 2006 - Dexia.com
Annual report 2006 - Dexia.com
Annual report 2006 - Dexia.com

You also want an ePaper? Increase the reach of your titles
YUMPU automatically turns print PDFs into web optimized ePapers that Google loves.
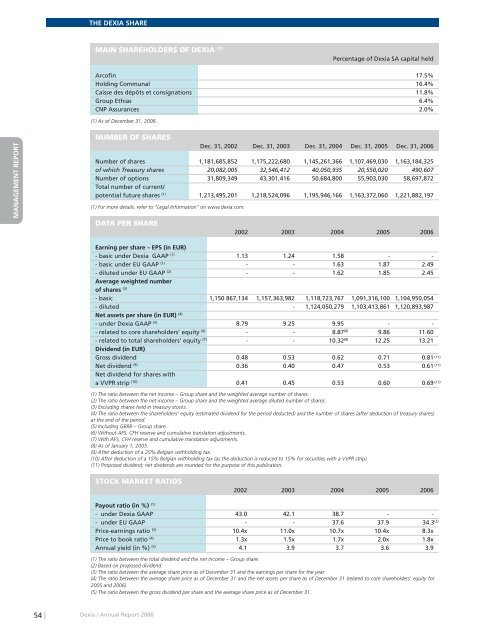
THE DEXIA SHARE<br />
MAIN SHAREHOLDERS OF DEXIA (1)<br />
Percentage of <strong>Dexia</strong> SA capital held<br />
Arcofin 17.5%<br />
Holding Communal 16.4%<br />
Caisse des dépôts et consignations 11.8%<br />
Group Ethias 6.4%<br />
CNP Assurances 2.0%<br />
(1) As of December 31, <strong>2006</strong>.<br />
MANAGEMENT REPORT<br />
COMPTES CONSOLIDÉS<br />
COMPTES SOCIAUX<br />
NUMBER OF SHARES<br />
Dec. 31, 2002 Dec. 31, 2003 Dec. 31, 2004 Dec. 31, 2005 Dec. 31, <strong>2006</strong><br />
Number of shares 1,181,685,852 1,175,222,680 1,145,261,366 1,107,469,030 1,163,184,325<br />
of which Treasury shares 20,082,005 32,546,412 40,050,935 20,550,020 490,607<br />
Number of options 31,809,349 43,301,416 50,684,800 55,903,030 58,697,872<br />
Total number of current/<br />
potential future shares (1) 1,213,495,201 1,218,524,096 1,195,946,166 1,163,372,060 1,221,882,197<br />
(1) For more details, refer to “Legal Information” on www.dexia.<strong>com</strong>.<br />
DATA PER SHARE<br />
2002 2003 2004 2005 <strong>2006</strong><br />
Earning per share – EPS (in EUR)<br />
- basic under <strong>Dexia</strong> GAAP (1) 1.13 1.24 1.58 - -<br />
- basic under EU GAAP (1) - - 1.63 1.87 2.49<br />
- diluted under EU GAAP (2) - - 1.62 1.85 2.45<br />
Average weighted number<br />
of shares (3)<br />
- basic 1,150 867,134 1,157,363,982 1,118,723,767 1,091,316,100 1,104,950,054<br />
- diluted - 1,124,050,279 1,103,413,861 1,120,893,987<br />
Net assets per share (in EUR) (4)<br />
- under <strong>Dexia</strong> GAAP (5) 8.79 9.25 9.95 - -<br />
- related to core shareholders’ equity (6) - - 8.87 (8) 9.86 11.60<br />
- related to total shareholders’ equity (7) - - 10.32 (8) 12.25 13.21<br />
Dividend (in EUR)<br />
Gross dividend 0.48 0.53 0.62 0.71 0.81<br />
Net dividend (9) 0.36 0.40 0.47 0.53 0.61<br />
Net dividend for shares with<br />
a VVPR strip (10) 0.41 0.45 0.53 0.60 0.69<br />
(11)<br />
(11)<br />
(11)<br />
(1) The ratio between the net in<strong>com</strong>e – Group share and the weighted average number of shares.<br />
(2) The ratio between the net in<strong>com</strong>e – Group share and the weighted average diluted number of shares.<br />
(3) Excluding shares held in treasury stocks.<br />
(4) The ratio between the shareholders’ equity (estimated dividend for the period deducted) and the number of shares (after deduction of treasury shares)<br />
at the end of the period.<br />
(5) Including GBRR – Group share.<br />
(6) Without AFS, CFH reserve and cumulative translation adjustments.<br />
(7) With AFS, CFH reserve and cumulative translation adjustments.<br />
(8) As of January 1, 2005.<br />
(9) After deduction of a 25% Belgian withholding tax.<br />
(10) After deduction of a 15% Belgian withholding tax (as the deduction is reduced to 15% for securities with a VVPR strip).<br />
(11) Proposed dividend; net dividends are rounded for the purpose of this publication.<br />
STOCK MARKET RATIOS<br />
2002 2003 2004 2005 <strong>2006</strong><br />
Payout ratio (in %) (1)<br />
- under <strong>Dexia</strong> GAAP 43.0 42.1 38.7 - -<br />
- under EU GAAP - - 37.6 37.9 34.3<br />
Price-earnings ratio (3) 10.4x 11.0x 10.7x 10.4x 8.3x<br />
Price to book ratio (4) 1.3x 1.5x 1.7x 2.0x 1.8x<br />
<strong>Annual</strong> yield (in %) (5) 4.1 3.9 3.7 3.6 3.9<br />
(1) The ratio between the total dividend and the net in<strong>com</strong>e – Group share.<br />
(2) Based on proposed dividend.<br />
(3) The ratio between the average share price as of December 31 and the earnings per share for the year.<br />
(4) The ratio between the average share price as of December 31 and the net assets per share as of December 31 (related to core shareholders’ equity for<br />
2005 and <strong>2006</strong>).<br />
(5) The ratio between the gross dividend per share and the average share price as of December 31.<br />
(2)<br />
54 |<br />
<strong>Dexia</strong> / <strong>Annual</strong> Report <strong>2006</strong>