Annual report 2006 - Dexia.com
Annual report 2006 - Dexia.com
Annual report 2006 - Dexia.com
You also want an ePaper? Increase the reach of your titles
YUMPU automatically turns print PDFs into web optimized ePapers that Google loves.
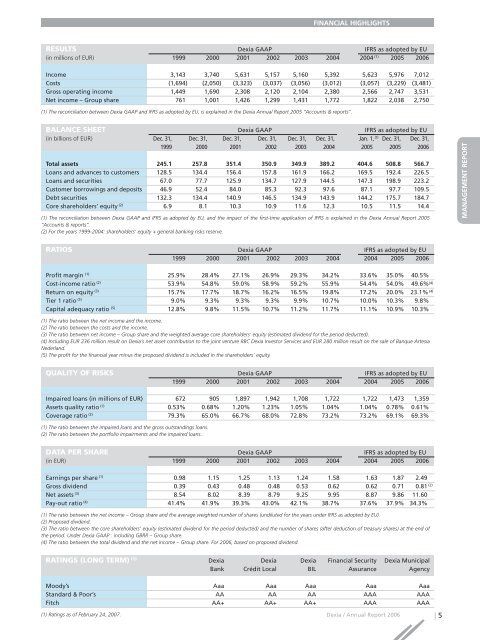
FINANCIAL HIGHLIGHTS<br />
RESULTS <strong>Dexia</strong> GAAP IFRS as adopted by EU<br />
(in millions of EUR) 1999 2000 2001 2002 2003 2004 2004 (1) 2005 <strong>2006</strong><br />
In<strong>com</strong>e 3,143 3,740 5,631 5,157 5,160 5,392 5,623 5,976 7,012<br />
Costs (1,694) (2,050) (3,323) (3,037) (3,056) (3,012) (3,057) (3,229) (3,481)<br />
Gross operating in<strong>com</strong>e 1,449 1,690 2,308 2,120 2,104 2,380 2,566 2,747 3,531<br />
Net in<strong>com</strong>e – Group share 761 1,001 1,426 1,299 1,431 1,772 1,822 2,038 2,750<br />
(1) The reconciliation between <strong>Dexia</strong> GAAP and IFRS as adopted by EU, is explained in the <strong>Dexia</strong> <strong>Annual</strong> Report 2005 “Accounts & <strong>report</strong>s”.<br />
BALANCE SHEET <strong>Dexia</strong> GAAP IFRS as adopted by EU<br />
(in billions of EUR) Dec. 31, Dec. 31, Dec. 31, Dec. 31, Dec. 31, Dec. 31, Jan. 1, (1) Dec. 31, Dec. 31,<br />
1999 2000 2001 2002 2003 2004 2005 2005 <strong>2006</strong><br />
Total assets 245.1 257.8 351.4 350.9 349.9 389.2 404.6 508.8 566.7<br />
Loans and advances to customers 128.5 134.4 156.4 157.8 161.9 166.2 169.5 192.4 226.5<br />
Loans and securities 67.0 77.7 125.9 134.7 127.9 144.5 147.3 198.9 223.2<br />
Customer borrowings and deposits 46.9 52.4 84.0 85.3 92.3 97.6 87.1 97.7 109.5<br />
Debt securities 132.3 134.4 140.9 146.5 134.9 143.9 144.2 175.7 184.7<br />
Core shareholders’ equity (2) 6.9 8.1 10.3 10.9 11.6 12.3 10.5 11.5 14.4<br />
(1) The reconciliation between <strong>Dexia</strong> GAAP and IFRS as adopted by EU, and the impact of the first-time application of IFRS is explained in the <strong>Dexia</strong> <strong>Annual</strong> Report 2005<br />
“Accounts & <strong>report</strong>s”.<br />
(2) For the years 1999-2004: shareholders’ equity + general banking risks reserve.<br />
RATIOS <strong>Dexia</strong> GAAP IFRS as adopted by EU<br />
1999 2000 2001 2002 2003 2004 2004 2005 <strong>2006</strong><br />
Profit margin (1) 25.9% 28.4% 27.1% 26.9% 29.3% 34.2% 33.6% 35.0% 40.5%<br />
Cost-in<strong>com</strong>e ratio (2) 53.9% 54.8% 59.0% 58.9% 59.2% 55.9% 54.4% 54.0% 49.6%<br />
Return on equity (3) 15.7% 17.7% 18.7% 16.2% 16.5% 19.8% 17.2% 20.0% 23.1%<br />
Tier 1 ratio (5) 9.0% 9.3% 9.3% 9.3% 9.9% 10.7% 10.0% 10.3% 9.8%<br />
Capital adequacy ratio (5) 12.8% 9.8% 11.5% 10.7% 11.2% 11.7% 11.1% 10.9% 10.3%<br />
(1) The ratio between the net in<strong>com</strong>e and the in<strong>com</strong>e.<br />
(2) The ratio between the costs and the in<strong>com</strong>e.<br />
(3) The ratio between net in<strong>com</strong>e – Group share and the weighted average core shareholders’ equity (estimated dividend for the period deducted).<br />
(4) Including EUR 236 million result on <strong>Dexia</strong>’s net asset contribution to the joint venture RBC <strong>Dexia</strong> Investor Services and EUR 280 million result on the sale of Banque Artesia<br />
Nederland.<br />
(5) The profit for the financial year minus the proposed dividend is included in the shareholders’ equity.<br />
QUALITY OF RISKS <strong>Dexia</strong> GAAP IFRS as adopted by EU<br />
1999 2000 2001 2002 2003 2004 2004 2005 <strong>2006</strong><br />
(4)<br />
(4)<br />
MANAGEMENT REPORT<br />
COMPTES CONSOLIDÉS<br />
COMPTES SOCIAUX<br />
Impaired loans (in millions of EUR) 672 905 1,897 1,942 1,708 1,722 1,722 1,473 1,359<br />
Assets quality ratio (1) 0.53% 0.68% 1.20% 1.23% 1.05% 1.04% 1.04% 0.78% 0.61%<br />
Coverage ratio (2) 79.3% 65.0% 66.7% 68.0% 72.8% 73.2% 73.2% 69.1% 69.3%<br />
(1) The ratio between the impaired loans and the gross outstandings loans.<br />
(2) The ratio between the portfolio impairments and the impaired loans.<br />
DATA PER SHARE <strong>Dexia</strong> GAAP IFRS as adopted by EU<br />
(in EUR) 1999 2000 2001 2002 2003 2004 2004 2005 <strong>2006</strong><br />
Earnings per share (1) 0.98 1.15 1.25 1.13 1.24 1.58 1.63 1.87 2.49 (2)<br />
Gross dividend 0.39 0.43 0.48 0.48 0.53 0.62 0.62 0.71 0.81 (2)<br />
Net assets (3) 8.54 8.02 8.39 8.79 9.25 9.95 8.87 9.86 11.60 (2)<br />
Pay-out ratio (4) 41.4% 41.9% 39.3% 43.0% 42.1% 38.7% 37.6% 37.9% 34.3%<br />
(1) The ratio between the net in<strong>com</strong>e – Group share and the average weighted number of shares (undiluted for the years under IFRS as adopted by EU).<br />
(2) Proposed dividend.<br />
(3) The ratio between the core shareholders’ equity (estimated dividend for the period deducted) and the number of shares (after deduction of treasury shares) at the end of<br />
the period. Under <strong>Dexia</strong> GAAP : including GBRR – Group share.<br />
(4) The ratio between the total dividend and the net in<strong>com</strong>e – Group share. For <strong>2006</strong>, based on proposed dividend.<br />
RATINGS (LONG TERM) (1) <strong>Dexia</strong> <strong>Dexia</strong> <strong>Dexia</strong> Financial Security <strong>Dexia</strong> Municipal<br />
Bank Crédit Local BIL Assurance Agency<br />
Moody’s Aaa Aaa Aaa Aaa Aaa<br />
Standard & Poor’s AA AA AA AAA AAA<br />
Fitch AA+ AA+ AA+ AAA AAA<br />
(1) Ratings as of February 24, 2007.<br />
<strong>Dexia</strong> / <strong>Annual</strong> Report <strong>2006</strong> | 5


