Annual report 2006 - Dexia.com
Annual report 2006 - Dexia.com
Annual report 2006 - Dexia.com

You also want an ePaper? Increase the reach of your titles
YUMPU automatically turns print PDFs into web optimized ePapers that Google loves.
ASSET MANAGEMENT<br />
Australian and the Italian teams. The money market and equities<br />
products represented more than 50% of <strong>Dexia</strong> AM net<br />
new cash in <strong>2006</strong>.<br />
<strong>Dexia</strong> AM continues to show a very good productivity ratio,<br />
with costs representing 13 basis points of assets under management,<br />
one of the lowest levels in the industry.<br />
Today, <strong>Dexia</strong> AM covers a large number of asset classes via<br />
a significant number of very efficient investment processes.<br />
Fixed in<strong>com</strong>e and money market investments represented<br />
41.1% of assets under management, equity investments<br />
21.2% and alternative investments the balance. With 13.4%<br />
(or EUR 14.3 billion) of its total assets under management in<br />
Socially Responsible Investment (SRI), <strong>Dexia</strong> Asset Management<br />
was awarded the “Sustainable Asset Manager of the<br />
Decade” by BANCO, a Swiss asset management magazine,<br />
recognizing its leadership in sustainable investment in continental<br />
Europe over the last decade. As a pioneer in SRI,<br />
<strong>Dexia</strong> AM created in <strong>2006</strong> its SRI Advisory Board which will<br />
assist the continuous development of the SRI approach and<br />
analysis.<br />
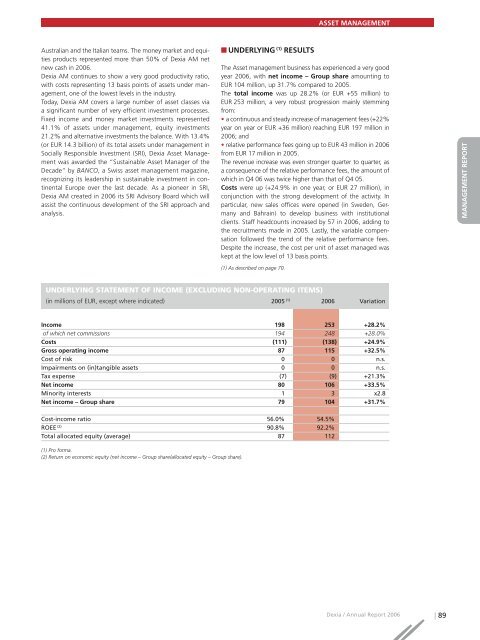
UNDERLYING (1) RESULTS<br />
The Asset management business has experienced a very good<br />
year <strong>2006</strong>, with net in<strong>com</strong>e – Group share amounting to<br />
EUR 104 million, up 31.7% <strong>com</strong>pared to 2005.<br />
The total in<strong>com</strong>e was up 28.2% (or EUR +55 million) to<br />
EUR 253 million, a very robust progression mainly stemming<br />
from:<br />
• a continuous and steady increase of management fees (+22%<br />
year on year or EUR +36 million) reaching EUR 197 million in<br />
<strong>2006</strong>; and<br />
• relative performance fees going up to EUR 43 million in <strong>2006</strong><br />
from EUR 17 million in 2005.<br />
The revenue increase was even stronger quarter to quarter, as<br />
a consequence of the relative performance fees, the amount of<br />
which in Q4 06 was twice higher than that of Q4 05.<br />
Costs were up (+24.9% in one year, or EUR 27 million), in<br />
conjunction with the strong development of the activity. In<br />
particular, new sales offices were opened (in Sweden, Germany<br />
and Bahrain) to develop business with institutional<br />
clients. Staff headcounts increased by 57 in <strong>2006</strong>, adding to<br />
the recruitments made in 2005. Lastly, the variable <strong>com</strong>pensation<br />
followed the trend of the relative performance fees.<br />
Despite the increase, the cost per unit of asset managed was<br />
kept at the low level of 13 basis points.<br />
(1) As described on page 70.<br />
UNDERLYING STATEMENT OF INCOME (EXCLUDING NON-OPERATING ITEMS)<br />
(in millions of EUR, except where indicated) 2005 (1) <strong>2006</strong> Variation<br />
MANAGEMENT REPORT<br />
COMPTES CONSOLIDÉS<br />
In<strong>com</strong>e 198 253 +28.2%<br />
of which net <strong>com</strong>missions 194 248 +28.0%<br />
Costs (111) (138) +24.9%<br />
Gross operating in<strong>com</strong>e 87 115 +32.5%<br />
Cost of risk 0 0 n.s.<br />
Impairments on (in)tangible assets 0 0 n.s.<br />
Tax expense (7) (9) +21.3%<br />
Net in<strong>com</strong>e 80 106 +33.5%<br />
Minority interests 1 3 x2.8<br />
Net in<strong>com</strong>e – Group share 79 104 +31.7%<br />
COMPTES SOCIAUX<br />
Cost-in<strong>com</strong>e ratio 56.0% 54.5%<br />
ROEE (2) 90.8% 92.2%<br />
Total allocated equity (average) 87 112<br />
(1) Pro forma.<br />
(2) Return on economic equity (net in<strong>com</strong>e – Group share/allocated equity – Group share).<br />
<strong>Dexia</strong> / <strong>Annual</strong> Report <strong>2006</strong> | 89