Annual report 2006 - Dexia.com
Annual report 2006 - Dexia.com
Annual report 2006 - Dexia.com

Create successful ePaper yourself
Turn your PDF publications into a flip-book with our unique Google optimized e-Paper software.
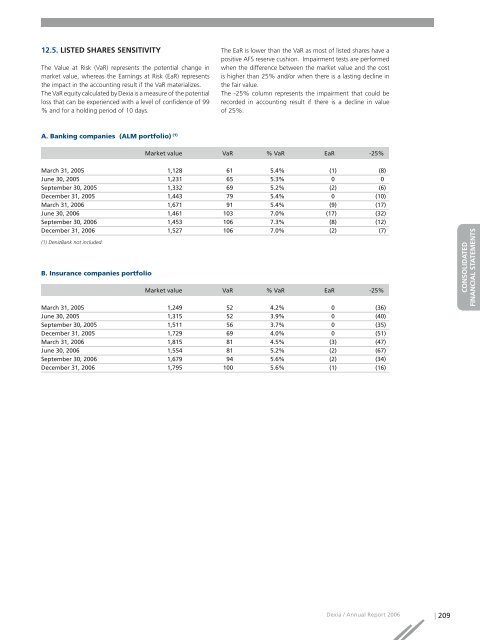
12.5. LISTED SHARES SENSITIVITY<br />
The Value at Risk (VaR) represents the potential change in<br />
market value, whereas the Earnings at Risk (EaR) represents<br />
the impact in the accounting result if the VaR materializes.<br />
The VaR equity calculated by <strong>Dexia</strong> is a measure of the potential<br />
loss that can be experienced with a level of confidence of 99<br />
% and for a holding period of 10 days.<br />
The EaR is lower than the VaR as most of listed shares have a<br />
positive AFS reserve cushion. Impairment tests are performed<br />
when the difference between the market value and the cost<br />
is higher than 25% and/or when there is a lasting decline in<br />
the fair value.<br />
The -25% column represents the impairment that could be<br />
recorded in accounting result if there is a decline in value<br />
of 25%.<br />
A. Banking <strong>com</strong>panies (ALM portfolio) (1)<br />
Market value VaR % VaR EaR -25%<br />
March 31, 2005 1,128 61 5.4% (1) (8)<br />
June 30, 2005 1,231 65 5.3% 0 0<br />
September 30, 2005 1,332 69 5.2% (2) (6)<br />
December 31, 2005 1,443 79 5.4% 0 (10)<br />
March 31, <strong>2006</strong> 1,671 91 5.4% (9) (17)<br />
June 30, <strong>2006</strong> 1,461 103 7.0% (17) (32)<br />
September 30, <strong>2006</strong> 1,453 106 7.3% (8) (12)<br />
December 31, <strong>2006</strong> 1,527 106 7.0% (2) (7)<br />
(1) DenizBank not included.<br />
B. Insurance <strong>com</strong>panies portfolio<br />
Market value VaR % VaR EaR -25%<br />
March 31, 2005 1,249 52 4.2% 0 (36)<br />
June 30, 2005 1,315 52 3.9% 0 (40)<br />
September 30, 2005 1,511 56 3.7% 0 (35)<br />
December 31, 2005 1,729 69 4.0% 0 (51)<br />
March 31, <strong>2006</strong> 1,815 81 4.5% (3) (47)<br />
June 30, <strong>2006</strong> 1,554 81 5.2% (2) (67)<br />
September 30, <strong>2006</strong> 1,679 94 5.6% (2) (34)<br />
December 31, <strong>2006</strong> 1,795 100 5.6% (1) (16)<br />
RAPPORT DE GESTION<br />
CONSOLIDATED<br />
FINANCIAL STATEMENTS<br />
COMPTES SOCIAUX<br />
<strong>Dexia</strong> / <strong>Annual</strong> Report <strong>2006</strong> | 209