Annual report 2006 - Dexia.com
Annual report 2006 - Dexia.com
Annual report 2006 - Dexia.com

You also want an ePaper? Increase the reach of your titles
YUMPU automatically turns print PDFs into web optimized ePapers that Google loves.
TREASURY AND FINANCIAL MARKETS<br />
UNDERLYING (1) RESULTS<br />
Treasury and Financial Markets (TFM) had once again a very<br />
good year in <strong>2006</strong>. The net in<strong>com</strong>e – Group share reached<br />
EUR 308 million, up 11.2% on 2005, which was a record year.<br />
Fixed In<strong>com</strong>e activities (of which mainly the Credit Spread Portfolio)<br />
was the main contributor to TFM’s net in<strong>com</strong>e (73%),<br />
the balance being equally split between Market Engineering<br />
and Trading (MET) (13%) and Treasury (14%).<br />
Total in<strong>com</strong>e for the full year <strong>2006</strong> amounted to EUR 561<br />
million, up 11.5%. This very good progression stems mainly<br />
from the MET segment, with a EUR +54 million growth as<br />
<strong>com</strong>pared to 2005. The Public Finance Market Engineering,<br />
the Personal Financial Services Engineering (PFSE), Foreign<br />
Exchange and Equities activities performed particularly well.<br />
Of note, a part of this in<strong>com</strong>e growth has to be analyzed<br />
in parallel with the increase of the tax expense, as explained<br />
below. The Fixed In<strong>com</strong>e segment contributed for EUR +22 million<br />
with notably Credit Spread Portfolio achieving a very<br />
successful year. Finally, the Treasury segment experienced a<br />
negative contribution due to the interest rates movement<br />
during the year <strong>2006</strong>.<br />
Costs remained unchanged <strong>com</strong>pared to 2005 to EUR 176 million.<br />
This very good achievement is related to the equity-brokerage<br />
activities in France, which were restructured in 2005,<br />
bringing down the cost base in <strong>2006</strong>. It is worth mentioning<br />
that this activity came back to profitability in <strong>2006</strong>. Without<br />
this effect, the costs would have increased slightly due<br />
to some IT expenses and recruitments. Thus, the underlying<br />
cost-in<strong>com</strong>e ratio decreased from 34.8% in 2005 to 31.5%<br />
in <strong>2006</strong>.<br />
(1) As described on page 70.<br />
As a consequence, the gross operating in<strong>com</strong>e amounted<br />
to EUR 384 million, a very robust increase by 17.3%. Of note,<br />
the quarter-on-quarter trend is also very good with a 19.5%<br />
increase.<br />
Cost of risk remained at a historic low level close to zero.<br />
Tax expense amounted to EUR 71 million for the full year<br />
<strong>2006</strong>, up 53.6% in one year. The rise is more than half<br />
explained by the increase of gross operating in<strong>com</strong>e, and for<br />
the largest remaining part by MET’s arbitrage strategies. To<br />
recall, those strategies embed cash and derivative instruments<br />
whose value changes can cause simultaneously revenue and<br />
tax increases if they go in one direction, or revenue and tax<br />
reductions if they go in the opposite direction. The impacts<br />
in <strong>2006</strong> were a EUR 11 million tax progression linked to a<br />
EUR 17 million revenue increase within the Equities and PFSE<br />
activities.<br />
The return on economic equity (ROEE) declined slightly to<br />
stand at the satisfactory level of 22.0%.<br />
MANAGEMENT REPORT<br />
COMPTES CONSOLIDÉS<br />
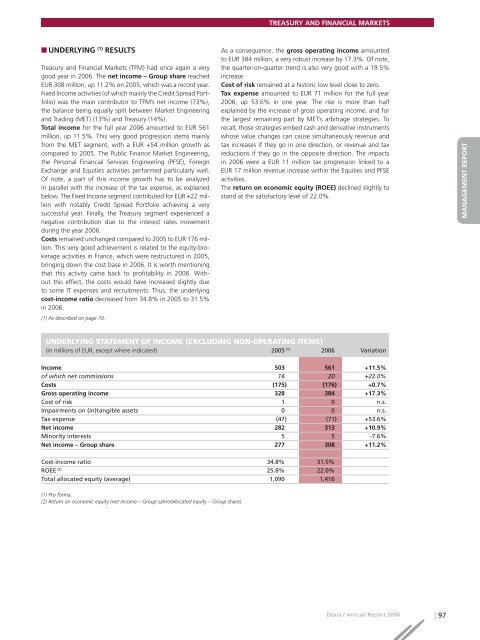
UNDERLYING STATEMENT OF INCOME (EXCLUDING NON-OPERATING ITEMS)<br />
(in millions of EUR, except where indicated) 2005 (1) <strong>2006</strong> Variation<br />
In<strong>com</strong>e 503 561 +11.5%<br />
of which net <strong>com</strong>missions 16 20 +22.0%<br />
Costs (175) (176) +0.7%<br />
Gross operating in<strong>com</strong>e 328 384 +17.3%<br />
Cost of risk 1 0 n.s.<br />
Impairments on (in)tangible assets 0 0 n.s.<br />
Tax expense (47) (71) +53.6%<br />
Net in<strong>com</strong>e 282 313 +10.9%<br />
Minority interests 5 5 -7.6%<br />
Net in<strong>com</strong>e – Group share 277 308 +11.2%<br />
COMPTES SOCIAUX<br />
Cost-in<strong>com</strong>e ratio 34.8% 31.5%<br />
ROEE (2) 25.8% 22.0%<br />
Total allocated equity (average) 1,090 1,416<br />
(1) Pro forma.<br />
(2) Return on economic equity (net in<strong>com</strong>e – Group sahre/allocated equity – Group share).<br />
<strong>Dexia</strong> / <strong>Annual</strong> Report <strong>2006</strong> | 97