Annual report 2006 - Dexia.com
Annual report 2006 - Dexia.com
Annual report 2006 - Dexia.com

You also want an ePaper? Increase the reach of your titles
YUMPU automatically turns print PDFs into web optimized ePapers that Google loves.
RISK MANAGEMENT<br />
MANAGEMENT REPORT<br />
COMPTES CONSOLIDÉS<br />
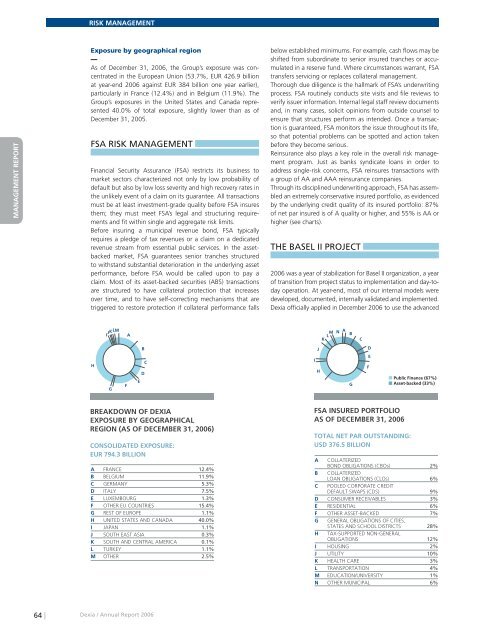
Exposure by geographical region<br />
As of December 31, <strong>2006</strong>, the Group’s exposure was concentrated<br />
in the European Union (53.7%, EUR 426.9 billion<br />
at year-end <strong>2006</strong> against EUR 384 billion one year earlier),<br />
particularly in France (12.4%) and in Belgium (11.9%). The<br />
Group’s exposures in the United States and Canada represented<br />
40.0% of total exposure, slightly lower than as of<br />
December 31, 2005.<br />
FSA RISK MANAGEMENT<br />
Financial Security Assurance (FSA) restricts its business to<br />
market sectors characterized not only by low probability of<br />
default but also by low loss severity and high recovery rates in<br />
the unlikely event of a claim on its guarantee. All transactions<br />
must be at least investment-grade quality before FSA insures<br />
them; they must meet FSA’s legal and structuring requirements<br />
and fit within single and aggregate risk limits.<br />
Before insuring a municipal revenue bond, FSA typically<br />
requires a pledge of tax revenues or a claim on a dedicated<br />
revenue stream from essential public services. In the assetbacked<br />
market, FSA guarantees senior tranches structured<br />
to withstand substantial deterioration in the underlying asset<br />
performance, before FSA would be called upon to pay a<br />
claim. Most of its asset-backed securities (ABS) transactions<br />
are structured to have collateral protection that increases<br />
over time, and to have self-correcting mechanisms that are<br />
triggered to restore protection if collateral performance falls<br />
below established minimums. For example, cash flows may be<br />
shifted from subordinate to senior insured tranches or accumulated<br />
in a reserve fund. Where circumstances warrant, FSA<br />
transfers servicing or replaces collateral management.<br />
Thorough due diligence is the hallmark of FSA’s underwriting<br />
process. FSA routinely conducts site visits and file reviews to<br />
verify issuer information. Internal legal staff review documents<br />
and, in many cases, solicit opinions from outside counsel to<br />
ensure that structures perform as intended. Once a transaction<br />
is guaranteed, FSA monitors the issue throughout its life,<br />
so that potential problems can be spotted and action taken<br />
before they be<strong>com</strong>e serious.<br />
Reinsurance also plays a key role in the overall risk management<br />
program. Just as banks syndicate loans in order to<br />
address single-risk concerns, FSA reinsures transactions with<br />
a group of AA and AAA reinsurance <strong>com</strong>panies.<br />
Through its disciplined underwriting approach, FSA has assembled<br />
an extremely conservative insured portfolio, as evidenced<br />
by the underlying credit quality of its insured portfolio: 87%<br />
of net par insured is of A quality or higher, and 55% is AA or<br />
higher (see charts).<br />
THE BASEL II PROJECT<br />
<strong>2006</strong> was a year of stabilization for Basel II organization, a year<br />
of transition from project status to implementation and day-today<br />
operation. At year-end, most of our internal models were<br />
developed, documented, internally validated and implemented.<br />
<strong>Dexia</strong> officially applied in December <strong>2006</strong> to use the advanced<br />
COMPTES SOCIAUX<br />
H<br />
LM<br />
JK<br />
I<br />
G<br />
F<br />
A<br />
B<br />
C<br />
D<br />
E<br />
K LM N A B<br />
C<br />
J<br />
I<br />
H<br />
G<br />
D<br />
F<br />
E<br />
Public Finance (67%)<br />
Asset-backed (33%)<br />
BREAKDOWN OF DEXIA<br />
EXPOSURE BY GEOGRAPHICAL<br />
REGION (AS OF DECEMBER 31, <strong>2006</strong>)<br />
CONSOLIDATED EXPOSURE:<br />
EUR 794.3 BILLION<br />
A FRANCE 12.4%<br />
B BELGIUM 11.9%<br />
C GERMANY 5.3%<br />
D ITALY 7.5%<br />
E LUXEMBOURG 1.3%<br />
F OTHER EU COUNTRIES 15.4%<br />
G REST OF EUROPE 1.1%<br />
H UNITED STATES AND CANADA 40.0%<br />
I JAPAN 1.1%<br />
J SOUTH EAST ASIA 0.3%<br />
K SOUTH AND CENTRAL AMERICA 0.1%<br />
L TURKEY 1.1%<br />
M OTHER 2.5%<br />
FSA INSURED PORTFOLIO<br />
AS OF DECEMBER 31, <strong>2006</strong><br />
TOTAL NET PAR OUTSTANDING:<br />
USD 376.5 BILLION<br />
A COLLATERIZED<br />
BOND OBLIGATIONS (CBOs) 2%<br />
B COLLATERIZED<br />
LOAN OBLIGATIONS (CLOs) 6%<br />
C POOLED CORPORATE CREDIT<br />
DEFAULT SWAPS (CDS) 9%<br />
D CONSUMER RECEIVABLES 3%<br />
E RESIDENTIAL 6%<br />
F OTHER ASSET-BACKED 7%<br />
G GENERAL OBLIGATIONS OF CITIES,<br />
STATES AND SCHOOL DISTRICTS 28%<br />
H TAX-SUPPORTED NON-GENERAL<br />
OBLIGATIONS 12%<br />
I HOUSING 2%<br />
J UTILITY 10%<br />
K HEALTH CARE 3%<br />
L TRANSPORTATION 4%<br />
M EDUCATION/UNIVERSITY 1%<br />
N OTHER MUNICIPAL 6%<br />
64 |<br />
<strong>Dexia</strong> / <strong>Annual</strong> Report <strong>2006</strong>