Annual report 2006 - Dexia.com
Annual report 2006 - Dexia.com
Annual report 2006 - Dexia.com

You also want an ePaper? Increase the reach of your titles
YUMPU automatically turns print PDFs into web optimized ePapers that Google loves.
FINANCIAL RESULTS<br />
In<strong>com</strong>e<br />
Costs<br />
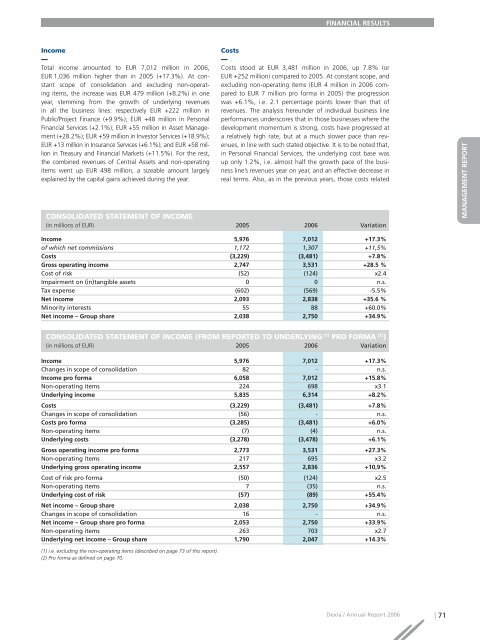
Total in<strong>com</strong>e amounted to EUR 7,012 million in <strong>2006</strong>,<br />
EUR 1,036 million higher than in 2005 (+17.3%). At constant<br />
scope of consolidation and excluding non-operating<br />
items, the increase was EUR 479 million (+8.2%) in one<br />
year, stemming from the growth of underlying revenues<br />
in all the business lines: respectively EUR +222 million in<br />
Public/Project Finance (+9.9%); EUR +48 million in Personal<br />
Financial Services (+2.1%); EUR +55 million in Asset Management<br />
(+28.2%); EUR +59 million in Investor Services (+18.9%);<br />
EUR +13 million in Insurance Services (+6.1%); and EUR +58 million<br />
in Treasury and Financial Markets (+11.5%). For the rest,<br />
the <strong>com</strong>bined revenues of Central Assets and non-operating<br />
items went up EUR 498 million, a sizeable amount largely<br />
explained by the capital gains achieved during the year.<br />
Costs stood at EUR 3,481 million in <strong>2006</strong>, up 7.8% (or<br />
EUR +252 million) <strong>com</strong>pared to 2005. At constant scope, and<br />
excluding non-operating items (EUR 4 million in <strong>2006</strong> <strong>com</strong>pared<br />
to EUR 7 million pro forma in 2005) the progression<br />
was +6.1%, i.e. 2.1 percentage points lower than that of<br />
revenues. The analysis hereunder of individual business line<br />
performances underscores that in those businesses where the<br />
development momentum is strong, costs have progressed at<br />
a relatively high rate, but at a much slower pace than revenues,<br />
in line with such stated objective. It is to be noted that,<br />
in Personal Financial Services, the underlying cost base was<br />
up only 1.2%, i.e. almost half the growth pace of the business<br />
line’s revenues year on year, and an effective decrease in<br />
real terms. Also, as in the previous years, those costs related<br />
CONSOLIDATED STATEMENT OF INCOME<br />
(in millions of EUR) 2005 <strong>2006</strong> Variation<br />
In<strong>com</strong>e 5,976 7,012 +17.3%<br />
of which net <strong>com</strong>missions 1,172 1,307 +11,5%<br />
Costs (3,229) (3,481) +7.8%<br />
Gross operating in<strong>com</strong>e 2,747 3,531 +28.5 %<br />
Cost of risk (52) (124) x2.4<br />
Impairment on (in)tangible assets 0 0 n.s.<br />
Tax expense (602) (569) -5.5%<br />
Net in<strong>com</strong>e 2,093 2,838 +35.6 %<br />
Minority interests 55 88 +60.0%<br />
Net in<strong>com</strong>e – Group share 2,038 2,750 +34.9%<br />
CONSOLIDATED STATEMENT OF INCOME (FROM REPORTED TO UNDERLYING (1) PRO FORMA (2) )<br />
(in millions of EUR) 2005 <strong>2006</strong> Variation<br />
In<strong>com</strong>e 5,976 7,012 +17.3%<br />
Changes in scope of consolidation 82 - n.s.<br />
In<strong>com</strong>e pro forma 6,058 7,012 +15.8%<br />
Non-operating items 224 698 x3.1<br />
Underlying in<strong>com</strong>e 5,835 6,314 +8.2%<br />
Costs (3,229) (3,481) +7.8%<br />
Changes in scope of consolidation (56) - n.s.<br />
Costs pro forma (3,285) (3,481) +6.0%<br />
Non-operating items (7) (4) n.s.<br />
Underlying costs (3,278) (3,478) +6.1%<br />
Gross operating in<strong>com</strong>e pro forma 2,773 3,531 +27.3%<br />
Non-operating items 217 695 x3.2<br />
Underlying gross operating in<strong>com</strong>e 2,557 2,836 +10,9%<br />
Cost of risk pro forma (50) (124) x2.5<br />
Non-operating items 7 (35) n.s.<br />
Underlying cost of risk (57) (89) +55.4%<br />
Net in<strong>com</strong>e – Group share 2,038 2,750 +34.9%<br />
Changes in scope of consolidation 16 - n.s.<br />
Net in<strong>com</strong>e – Group share pro forma 2,053 2,750 +33.9%<br />
Non-operating items 263 703 x2.7<br />
Underlying net in<strong>com</strong>e – Group share 1,790 2,047 +14.3%<br />
MANAGEMENT REPORT<br />
COMPTES CONSOLIDÉS<br />
COMPTES SOCIAUX<br />
(1) i.e. excluding the non-operating items (described on page 73 of this <strong>report</strong>).<br />
(2) Pro forma as defined on page 70.<br />
<strong>Dexia</strong> / <strong>Annual</strong> Report <strong>2006</strong> | 71