pdf (2.5 MB) - METRO Group
pdf (2.5 MB) - METRO Group
pdf (2.5 MB) - METRO Group

You also want an ePaper? Increase the reach of your titles
YUMPU automatically turns print PDFs into web optimized ePapers that Google loves.
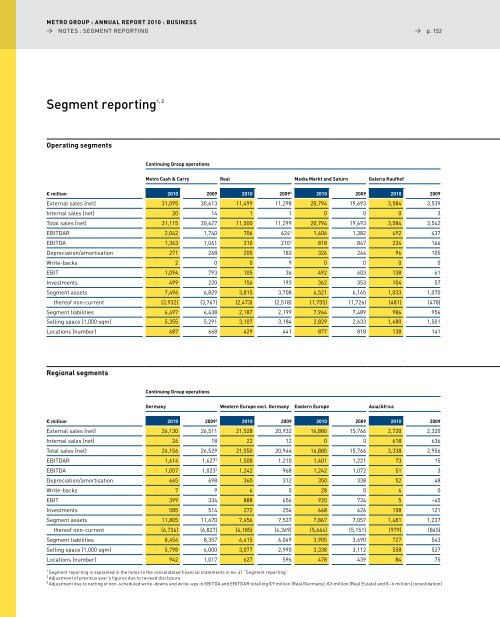
<strong>METRO</strong> GROUP : ANNUAL REPORT 2010 : BUSINESS<br />
→ NOTES : SEGMENT REPORTING<br />
1, 2<br />
Segment reporting<br />
Operating segments<br />
Continuing <strong>Group</strong> operations<br />
Metro Cash & Carry Real Media Markt and Saturn Galeria Kaufhof<br />
→ p. 152<br />
€ million 2010 2009 2010 20093 2010 2009 2010 2009<br />
External sales (net) 31,095 30,613 11,499 11,298 20,794 19,693 3,584 3,539<br />
Internal sales (net) 20 14 1 1 0 0 0 3<br />
Total sales (net) 31,115 30,627 11,500 11,299 20,794 19,693 3,584 3,542<br />
EBITdAR 2,042 1,740 706 6243 1,406 1,382 492 437<br />
EBITdA 1,363 1,061 310 2103 818 847 234 166<br />
depreciation/amortisation 271 268 205 183 326 244 96 105<br />
Write-backs 2 0 0 9 0 0 0 0<br />
EBIT 1,094 793 105 36 492 603 138 61<br />
Investments 499 220 156 193 362 353 104 57<br />
Segment assets 7,496 6,829 3,815 3,708 6,521 6,165 1,033 1,070<br />
thereof non-current (3,932) (3,767) (2,473) (2,518) (1,755) (1,726) (481) (478)<br />
Segment liabilities 6,497 6,438 2,187 2,199 7,964 7,489 986 956<br />
Selling space (1,000 sqm) 5,355 5,291 3,107 3,184 2,829 2,633 1,480 1,501<br />
locations (number) 687 668 429 441 877 818 138 141<br />
Regional segments<br />
Continuing <strong>Group</strong> operations<br />
Germany Western Europe excl. Germany Eastern Europe Asia/Africa<br />
€ million 2010 20093 2010 2009 2010 2009 2010 2009<br />
External sales (net) 26,130 26,511 21,528 20,932 16,880 15,766 2,720 2,320<br />
Internal sales (net) 26 18 22 12 0 0 618 636<br />
Total sales (net) 26,156 26,529 21,550 20,944 16,880 15,766 3,338 2,956<br />
EBITdAR 1,614 1,6273 1,508 1,210 1,401 1,221 73 15<br />
EBITdA 1,057 1,0233 1,242 968 1,242 1,072 51 3<br />
depreciation/amortisation 665 698 360 312 350 338 52 48<br />
Write-backs 7 9 6 0 28 0 6 0<br />
EBIT 399 334 888 656 920 734 5 –45<br />
Investments 585 514 272 256 668 626 158 121<br />
Segment assets 11,805 11,670 7,656 7,537 7,867 7,057 1,481 1,237<br />
thereof non-current (6,736) (6,827) (4,185) (4,369) (5,664) (5,151) (979) (845)<br />
Segment liabilities 8,454 8,357 6,415 6,049 3,905 3,690 727 543<br />
Selling space (1,000 sqm) 5,798 6,000 3,077 2,990 3,338 3,112 558 527<br />
locations (number) 942 1,017 627 596 478 439 84 75<br />
1 Segment reporting is explained in the notes to the consolidated financial statements in no. 41 “Segment reporting”<br />
2 Adjustment of previous year’s figures due to revised disclosure<br />
3 Adjustment due to netting of non-scheduled write-downs and write-ups in EBITdA and EBITdAR totalling €9 million (Real/Germany), €6 million (Real Estate) and €–6 million (consolidation)