pdf (2.5 MB) - METRO Group
pdf (2.5 MB) - METRO Group
pdf (2.5 MB) - METRO Group

You also want an ePaper? Increase the reach of your titles
YUMPU automatically turns print PDFs into web optimized ePapers that Google loves.
<strong>METRO</strong> GROUP : ANNUAL REPORT 2010 : BUSINESS<br />
→ GROUP MANAGEMENT REPORT : 4. FINANCIAL ANd ASSET POSITION<br />
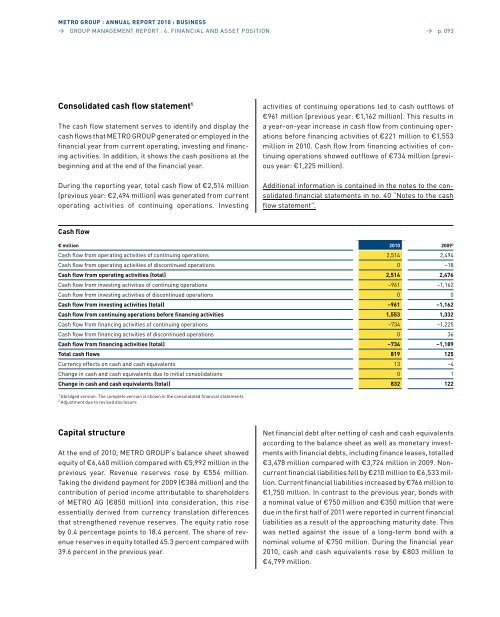
Consolidated cash flow statement 1<br />
The cash flow statement serves to identify and display the<br />
cash flows that <strong>METRO</strong> GROUP generated or employed in the<br />
financial year from current operating, investing and financing<br />
activities. In addition, it shows the cash positions at the<br />
beginning and at the end of the financial year.<br />
during the reporting year, total cash flow of €2,514 million<br />
(previous year: €2,494 million) was generated from current<br />
operating activities of continuing operations. Investing<br />
Cash flow<br />
Capital structure<br />
At the end of 2010, <strong>METRO</strong> GROUP’s balance sheet showed<br />
equity of €6,460 million compared with €5,992 million in the<br />
previous year. Revenue reserves rose by €554 million.<br />
Taking the dividend payment for 2009 (€386 million) and the<br />
contribution of period income attributable to shareholders<br />
of <strong>METRO</strong> AG (€850 million) into consideration, this rise<br />
essentially derived from currency translation differences<br />
that strengthened revenue reserves. The equity ratio rose<br />
by 0.4 percentage points to 18.4 percent. The share of revenue<br />
reserves in equity totalled 45.3 percent compared with<br />
39.6 percent in the previous year.<br />
→ p. 093<br />
activities of continuing operations led to cash outflows of<br />
€961 million (previous year: €1,162 million). This results in<br />
a year-on-year increase in cash flow from continuing operations<br />
before financing activities of €221 million to €1,553<br />
million in 2010. Cash flow from financing activities of continuing<br />
operations showed outflows of €734 million (previous<br />
year: €1,225 million).<br />
Additional information is contained in the notes to the consolidated<br />
financial statements in no. 40 “Notes to the cash<br />
flow statement”.<br />
€ million 2010 20092 Cash flow from operating activities of continuing operations 2,514 2,494<br />
Cash flow from operating activities of discontinued operations 0 –18<br />
Cash flow from operating activities (total) 2,514 2,476<br />
Cash flow from investing activities of continuing operations –961 –1,162<br />
Cash flow from investing activities of discontinued operations 0 0<br />
Cash flow from investing activities (total) –961 –1,162<br />
Cash flow from continuing operations before financing activities 1,553 1,332<br />
Cash flow from financing activities of continuing operations –734 –1,225<br />
Cash flow from financing activities of discontinued operations 0 36<br />
Cash flow from financing activities (total) –734 –1,189<br />
Total cash flows 819 125<br />
Currency effects on cash and cash equivalents 13 –4<br />
Change in cash and cash equivalents due to initial consolidations 0 1<br />
Change in cash and cash equivalents (total) 832 122<br />
1 Abridged version. The complete version is shown in the consolidated financial statements<br />
2 Adjustment due to revised disclosure<br />
Net financial debt after netting of cash and cash equivalents<br />
according to the balance sheet as well as monetary investments<br />
with financial debts, including finance leases, totalled<br />
€3,478 million compared with €3,724 million in 2009. Noncurrent<br />
financial liabilities fell by €210 million to €6,533 million.<br />
Current financial liabilities increased by €766 million to<br />
€1,750 million. In contrast to the previous year, bonds with<br />
a nominal value of €750 million and €350 million that were<br />
due in the first half of 2011 were reported in current financial<br />
liabilities as a result of the approaching maturity date. This<br />
was netted against the issue of a long-term bond with a<br />
nominal volume of €750 million. during the financial year<br />
2010, cash and cash equivalents rose by €803 million to<br />
€4,799 million.