pdf (2.5 MB) - METRO Group
pdf (2.5 MB) - METRO Group
pdf (2.5 MB) - METRO Group

Create successful ePaper yourself
Turn your PDF publications into a flip-book with our unique Google optimized e-Paper software.
<strong>METRO</strong> GROUP : ANNUAL REPORT 2010 : BUSINESS<br />
→ GROUP MANAGEMENT REPORT : 3. EARNINGS POSITION<br />
3. Earnings position<br />
Overview of <strong>Group</strong> business developments<br />
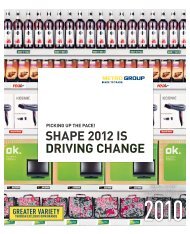
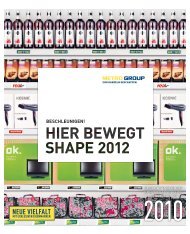
<strong>METRO</strong> GROUP can look back on a successful financial year<br />
2010. All sales divisions increased sales compared with<br />
2009. <strong>Group</strong> sales reached €67.3 billion, an increase of 2.6 percent<br />
year-on-year (in local currencies: +0.9 percent).<br />
At €3,591 million, EBITdA clearly exceeded the previous<br />
year’s level of €3,068 million. Adjusted for special items,<br />
EBITdA rose to €3,726 million during the reporting year, an<br />
increase of 12.3 percent.<br />
<strong>Group</strong> EBIT climbed by €530 million to €2,211 million. EBIT<br />
before special items increased by 19.3 percent to €2,415 million,<br />
the highest result in the history of <strong>METRO</strong> GROUP.<br />
Sales and earnings developments<br />
In the financial year 2010, <strong>METRO</strong> GROUP sales rose by 2.6 percent<br />
to €67.3 billion (previous year: €65.5 billion).<br />
In Germany, sales declined by 1.4 percent to €26.1 billion;<br />
adjusted for location and other divestments, however, sales<br />
matched the previous year’s level. International sales rose<br />
by 5.4 percent to €41.1 billion (in local currencies: +<strong>2.5</strong> percent).<br />
As a result, the international share of sales rose from<br />
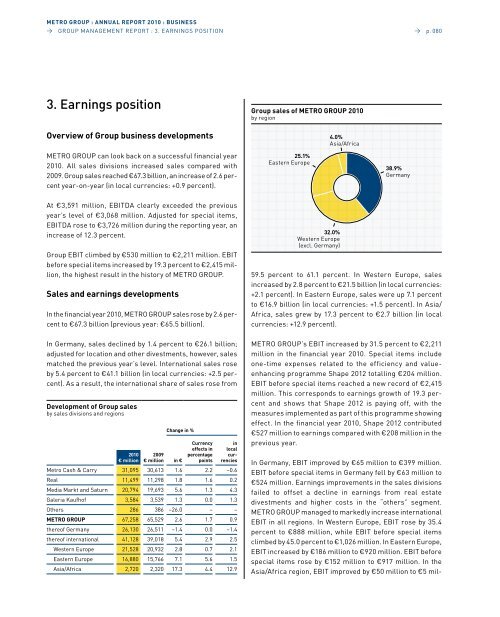
Development of <strong>Group</strong> sales<br />
by sales divisions and regions<br />
Change in %<br />
Currency in<br />
effects in local<br />
2010 2009 percentage cur-<br />
€ million € million in € points rencies<br />
Metro Cash & Carry 31,095 30,613 1.6 2.2 –0.6<br />
Real 11,499 11,298 1.8 1.6 0.2<br />
Media Markt and Saturn 20,794 19,693 5.6 1.3 4.3<br />
Galeria Kaufhof 3,584 3,539 1.3 0.0 1.3<br />
Others 286 386 –26.0 – –<br />
<strong>METRO</strong> GROUP 67,258 65,529 2.6 1.7 0.9<br />
thereof Germany 26,130 26,511 –1.4 0.0 –1.4<br />
thereof international 41,128 39,018 5.4 2.9 <strong>2.5</strong><br />
western Europe 21,528 20,932 2.8 0.7 2.1<br />
Eastern Europe 16,880 15,766 7.1 5.6 1.5<br />
Asia/Africa 2,720 2,320 17.3 4.4 12.9<br />
<strong>Group</strong> sales of <strong>METRO</strong> GROUP 2010<br />
by region<br />
25.1%<br />
Eastern Europe<br />
32.0%<br />
western Europe<br />
(excl. Germany)<br />
4.0%<br />
Asia/Africa<br />
38.9%<br />
Germany<br />
→ p. 080<br />
59.5 percent to 61.1 percent. In western Europe, sales<br />
increased by 2.8 percent to €21.5 billion (in local currencies:<br />
+2.1 percent). In Eastern Europe, sales were up 7.1 percent<br />
to €16.9 billion (in local currencies: +1.5 percent). In Asia/<br />
Africa, sales grew by 17.3 percent to €2.7 billion (in local<br />
currencies: +12.9 percent).<br />
<strong>METRO</strong> GROUP’s EBIT increased by 31.5 percent to €2,211<br />
million in the financial year 2010. Special items include<br />
one-time expenses related to the efficiency and valueenhancing<br />
programme Shape 2012 totalling €204 million.<br />
EBIT before special items reached a new record of €2,415<br />
million. This corresponds to earnings growth of 19.3 percent<br />
and shows that Shape 2012 is paying off, with the<br />
measures implemented as part of this programme showing<br />
effect. In the financial year 2010, Shape 2012 contributed<br />
€527 million to earnings compared with €208 million in the<br />
previous year.<br />
In Germany, EBIT improved by €65 million to €399 million.<br />
EBIT before special items in Germany fell by €63 million to<br />
€524 million. Earnings improvements in the sales divisions<br />
failed to offset a decline in earnings from real estate<br />
divestments and higher costs in the “others” segment.<br />
<strong>METRO</strong> GROUP managed to markedly increase international<br />
EBIT in all regions. In western Europe, EBIT rose by 35.4<br />
percent to €888 million, while EBIT before special items<br />
climbed by 45.0 percent to €1,026 million. In Eastern Europe,<br />
EBIT increased by €186 million to €920 million. EBIT before<br />
special items rose by €152 million to €917 million. In the<br />
Asia/Africa region, EBIT improved by €50 million to €5 mil-