pdf (2.5 MB) - METRO Group
pdf (2.5 MB) - METRO Group
pdf (2.5 MB) - METRO Group

You also want an ePaper? Increase the reach of your titles
YUMPU automatically turns print PDFs into web optimized ePapers that Google loves.
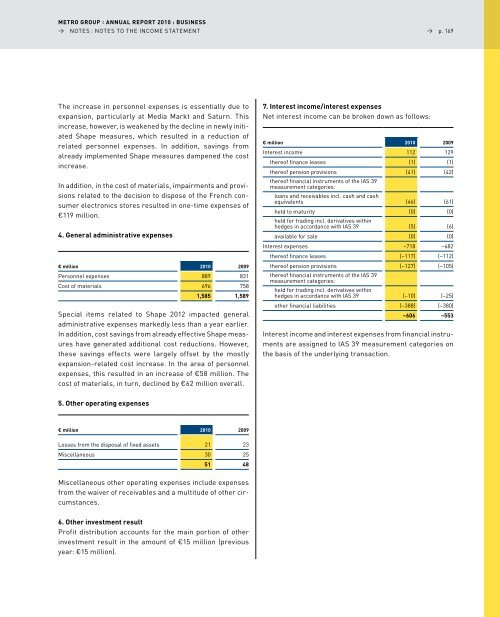
<strong>METRO</strong> GROUP : ANNUAL REPORT 2010 : BUSINESS<br />
→ NOTES : NOTES TO ThE INCOME STATEMENT<br />
The increase in personnel expenses is essentially due to<br />
expansion, particularly at Media Markt and Saturn. This<br />
increase, however, is weakened by the decline in newly initiated<br />
Shape measures, which resulted in a reduction of<br />
related personnel expenses. In addition, savings from<br />
already implemented Shape measures dampened the cost<br />
increase.<br />
In addition, in the cost of materials, impairments and provisions<br />
related to the decision to dispose of the french consumer<br />
electronics stores resulted in one-time expenses of<br />
€119 million.<br />
4. General administrative expenses<br />
€ million 2010 2009<br />
Personnel expenses 889 831<br />
Cost of materials 696 758<br />
1,585 1,589<br />
Special items related to Shape 2012 impacted general<br />
administrative expenses markedly less than a year earlier.<br />
In addition, cost savings from already effective Shape measures<br />
have generated additional cost reductions. however,<br />
these savings effects were largely offset by the mostly<br />
expansion-related cost increase. In the area of personnel<br />
expenses, this resulted in an increase of €58 million. The<br />
cost of materials, in turn, declined by €62 million overall.<br />
5. Other operating expenses<br />
€ million 2010 2009<br />
losses from the disposal of fixed assets 21 23<br />
Miscellaneous 30 25<br />
51 48<br />
Miscellaneous other operating expenses include expenses<br />
from the waiver of receivables and a multitude of other circumstances.<br />
6. Other investment result<br />
Profit distribution accounts for the main portion of other<br />
investment result in the amount of €15 million (previous<br />
year: €15 million).<br />
7. Interest income/interest expenses<br />
Net interest income can be broken down as follows:<br />
→ p. 169<br />
€ million 2010 2009<br />
Interest income 112 129<br />
thereof finance leases (1) (1)<br />
thereof pension provisions (41) (42)<br />
thereof financial instruments of the IAS 39<br />
measurement categories:<br />
loans and receivables incl. cash and cash<br />
equivalents (46) (61)<br />
held to maturity (0) (0)<br />
held for trading incl. derivatives within<br />
hedges in accordance with IAS 39 (5) (6)<br />
available for sale (0) (0)<br />
Interest expenses –718 –682<br />
thereof finance leases (–117) (–112)<br />
thereof pension provisions (–127) (–105)<br />
thereof financial instruments of the IAS 39<br />
measurement categories:<br />
held for trading incl. derivatives within<br />
hedges in accordance with IAS 39 (–10) (–25)<br />
other financial liabilities (–388) (–380)<br />
–606 –553<br />
Interest income and interest expenses from financial instruments<br />
are assigned to IAS 39 measurement categories on<br />
the basis of the underlying transaction.