pdf (2.5 MB) - METRO Group
pdf (2.5 MB) - METRO Group
pdf (2.5 MB) - METRO Group

You also want an ePaper? Increase the reach of your titles
YUMPU automatically turns print PDFs into web optimized ePapers that Google loves.
<strong>METRO</strong> GROUP : ANNUAL REPORT 2010 : BUSINESS<br />
→ GROUP MANAGEMENT REPORT : 4. FINANCIAL ANd ASSET POSITION<br />
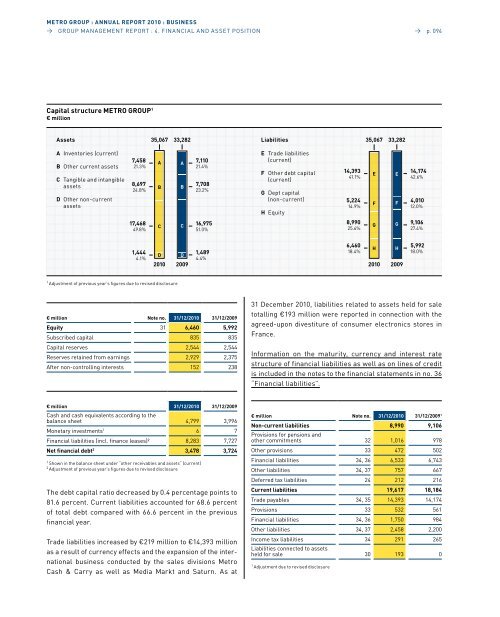
Capital structure <strong>METRO</strong> GROUP 1<br />
€ million<br />
Assets<br />
A Inventories (current)<br />
B Other current assets<br />
C Tangible and intangible<br />
assets<br />
D Other non-current<br />
assets<br />
7,458<br />
21.3%<br />
8,697<br />
24.8%<br />
17,468<br />
49.8%<br />
1,444<br />
4.1%<br />
35,067<br />
D<br />
2010<br />
1 Adjustment of previous year’s figures due to revised disclosure<br />
€ million Note no. 31/12/2010 31/12/2009<br />
Equity 31 6,460 5,992<br />
Subscribed capital 835 835<br />
Capital reserves 2,544 2,544<br />
Reserves retained from earnings 2,929 2,375<br />
After non-controlling interests 152 238<br />
€ million 31/12/2010 31/12/2009<br />
Cash and cash equivalents according to the<br />
balance sheet 4,799 3,996<br />
Monetary investments1 6 7<br />
Financial liabilities (incl. finance leases)² 8,283 7,727<br />
Net financial debt2 3,478 3,724<br />
1 Shown in the balance sheet under “other receivables and assets“ (current)<br />
2 Adjustment of previous year’s figures due to revised disclosure<br />
The debt capital ratio decreased by 0.4 percentage points to<br />
81.6 percent. Current liabilities accounted for 68.6 percent<br />
of total debt compared with 66.6 percent in the previous<br />
financial year.<br />
Trade liabilities increased by €219 million to €14,393 million<br />
as a result of currency effects and the expansion of the international<br />
business conducted by the sales divisions Metro<br />
Cash & Carry as well as Media Markt and Saturn. As at<br />
A<br />
B<br />
C<br />
33,282<br />
A<br />
B<br />
C<br />
D<br />
2009<br />
7,110<br />
21.4%<br />
7,708<br />
23.2%<br />
16,975<br />
51.0%<br />
1,489<br />
4.4%<br />
Liabilities<br />
E Trade liabilities<br />
(current)<br />
F Other debt capital<br />
(current)<br />
G dept capital<br />
(non-current)<br />
H Equity<br />
→ p. 094<br />
31 december 2010, liabilities related to assets held for sale<br />
totalling €193 million were reported in connection with the<br />
agreed-upon divestiture of consumer electronics stores in<br />
France.<br />
Information on the maturity, currency and interest rate<br />
structure of financial liabilities as well as on lines of credit<br />
is included in the notes to the financial statements in no. 36<br />
“Financial liabilities”.<br />
€ million Note no. 31/12/2010 31/12/20091 Non-current liabilities<br />
Provisions for pensions and<br />
8,990 9,106<br />
other commitments 32 1,016 978<br />
Other provisions 33 472 502<br />
Financial liabilities 34, 36 6,533 6,743<br />
Other liabilities 34, 37 757 667<br />
deferred tax liabilities 24 212 216<br />
Current liabilities 19,617 18,184<br />
Trade payables 34, 35 14,393 14,174<br />
Provisions 33 532 561<br />
Financial liabilities 34, 36 1,750 984<br />
Other liabilities 34, 37 2,458 2,200<br />
Income tax liabilities<br />
Liabilities connected to assets<br />
34 291 265<br />
held for sale 30 193 0<br />
1 Adjustment due to revised disclosure<br />
14,393<br />
41.1%<br />
5,224<br />
14.9%<br />
8,990<br />
25.6%<br />
6,460<br />
18.4%<br />
35,067<br />
E<br />
F<br />
G<br />
H<br />
2010<br />
33,282<br />
E<br />
F<br />
G<br />
H<br />
2009<br />
14,174<br />
42.6%<br />
4,010<br />
12.0%<br />
9,106<br />
27.4%<br />
5,992<br />
18.0%