pdf (2.5 MB) - METRO Group
pdf (2.5 MB) - METRO Group
pdf (2.5 MB) - METRO Group

Create successful ePaper yourself
Turn your PDF publications into a flip-book with our unique Google optimized e-Paper software.
<strong>METRO</strong> GROUP : ANNUAL REPORT 2010 : BUSINESS<br />
→ GROUP MANAGEMENT REPORT : 3. EARNINGS POSITION<br />
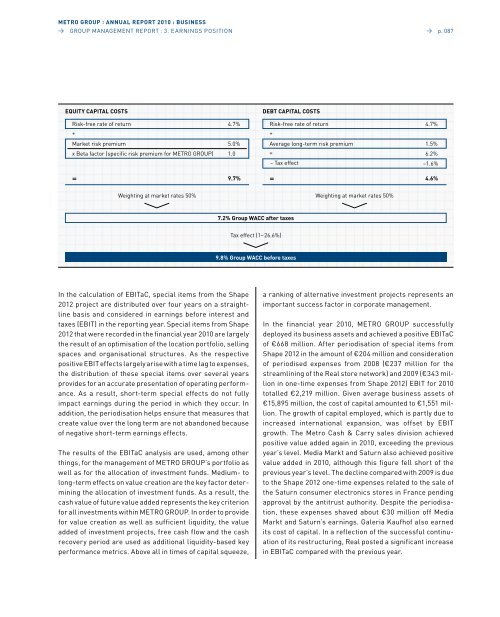
EqUITy CAPITAL COSTS<br />
Risk-free rate of return<br />
+<br />
4.7%<br />
Market risk premium 5.0%<br />
x Beta factor (specific risk premium for <strong>METRO</strong> GROUP) 1.0<br />
= 9.7%<br />
weighting at market rates 50%<br />
In the calculation of EBITaC, special items from the Shape<br />
2012 project are distributed over four years on a straightline<br />
basis and considered in earnings before interest and<br />
taxes (EBIT) in the reporting year. Special items from Shape<br />
2012 that were recorded in the financial year 2010 are largely<br />
the result of an optimisation of the location portfolio, selling<br />
spaces and organisational structures. As the respective<br />
positive EBIT effects largely arise with a time lag to expenses,<br />
the distribution of these special items over several years<br />
provides for an accurate presentation of operating performance.<br />
As a result, short-term special effects do not fully<br />
impact earnings during the period in which they occur. In<br />
addition, the periodisation helps ensure that measures that<br />
create value over the long term are not abandoned because<br />
of negative short-term earnings effects.<br />
The results of the EBITaC analysis are used, among other<br />
things, for the management of <strong>METRO</strong> GROUP’s portfolio as<br />
well as for the allocation of investment funds. Medium- to<br />
long-term effects on value creation are the key factor determining<br />
the allocation of investment funds. As a result, the<br />
cash value of future value added represents the key criterion<br />
for all investments within <strong>METRO</strong> GROUP. In order to provide<br />
for value creation as well as sufficient liquidity, the value<br />
added of investment projects, free cash flow and the cash<br />
recovery period are used as additional liquidity-based key<br />
performance metrics. Above all in times of capital squeeze,<br />
7.2% <strong>Group</strong> WACC after taxes<br />
Tax effect (1–26.6%)<br />
9.8% <strong>Group</strong> WACC before taxes<br />
→ p. 087<br />
DEBT CAPITAL COSTS<br />
Risk-free rate of return 4.7%<br />
+<br />
Average long-term risk premium 1.5%<br />
= 6.2%<br />
– Tax effect –1.6%<br />
= 4.6%<br />
weighting at market rates 50%<br />
a ranking of alternative investment projects represents an<br />
important success factor in corporate management.<br />
In the financial year 2010, <strong>METRO</strong> GROUP successfully<br />
deployed its business assets and achieved a positive EBITaC<br />
of €668 million. After periodisation of special items from<br />
Shape 2012 in the amount of €204 million and consideration<br />
of periodised expenses from 2008 (€237 million for the<br />
streamlining of the Real store network) and 2009 (€343 million<br />
in one-time expenses from Shape 2012) EBIT for 2010<br />
totalled €2,219 million. Given average business assets of<br />
€15,895 million, the cost of capital amounted to €1,551 million.<br />
The growth of capital employed, which is partly due to<br />
increased international expansion, was offset by EBIT<br />
growth. The Metro Cash & Carry sales division achieved<br />
positive value added again in 2010, exceeding the previous<br />
year’s level. Media Markt and Saturn also achieved positive<br />
value added in 2010, although this figure fell short of the<br />
previous year’s level. The decline compared with 2009 is due<br />
to the Shape 2012 one-time expenses related to the sale of<br />
the Saturn consumer electronics stores in France pending<br />
approval by the antitrust authority. despite the periodisation,<br />
these expenses shaved about €30 million off Media<br />
Markt and Saturn’s earnings. Galeria Kaufhof also earned<br />
its cost of capital. In a reflection of the successful continuation<br />
of its restructuring, Real posted a significant increase<br />
in EBITaC compared with the previous year.