pdf (2.5 MB) - METRO Group
pdf (2.5 MB) - METRO Group
pdf (2.5 MB) - METRO Group

Create successful ePaper yourself
Turn your PDF publications into a flip-book with our unique Google optimized e-Paper software.
<strong>METRO</strong> GROUP : ANNUAL REPORT 2010 : BUSINESS<br />
→ GROUP MANAGEMENT REPORT : 3. EARNINGS POSITION<br />
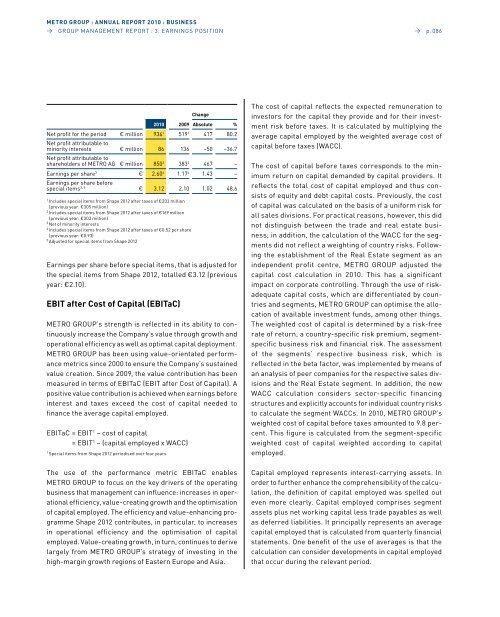
Change<br />
2010 2009 Absolute %<br />
Net profit for the period € million 936 1 519 1 417 80.2<br />
Net profit attributable to<br />
minority interests € million 86 136 –50 –36.7<br />
Net profit attributable to<br />
shareholders of <strong>METRO</strong> AG € million 8502 3832 467 –<br />
Earnings per share 3 € 2.60 4 1.17 4 1.43 –<br />
Earnings per share before<br />
special items 3, 5 € 3.12 2.10 1.02 48.6<br />
1 Includes special items from Shape 2012 after taxes of €203 million<br />
(previous year: €305 million)<br />
2 Includes special items from Shape 2012 after taxes of €169 million<br />
(previous year: €303 million)<br />
3 Net of minority interests<br />
4 Includes special items from Shape 2012 after taxes of €0.52 per share<br />
(previous year: €0.93)<br />
5 Adjusted for special items from Shape 2012<br />
Earnings per share before special items, that is adjusted for<br />
the special items from Shape 2012, totalled €3.12 (previous<br />
year: €2.10).<br />
EBIT after Cost of Capital (EBITaC)<br />
<strong>METRO</strong> GROUP’s strength is reflected in its ability to continuously<br />
increase the Company’s value through growth and<br />
operational efficiency as well as optimal capital deployment.<br />
<strong>METRO</strong> GROUP has been using value-orientated performance<br />
metrics since 2000 to ensure the Company’s sustained<br />
value creation. Since 2009, the value contribution has been<br />
measured in terms of EBITaC (EBIT after Cost of Capital). A<br />
positive value contribution is achieved when earnings before<br />
interest and taxes exceed the cost of capital needed to<br />
finance the average capital employed.<br />
EBITaC = EBIT 1 – cost of capital<br />
= EBIT 1 – (capital employed x wACC)<br />
1 Special items from Shape 2012 periodised over four years<br />
The use of the performance metric EBITaC enables<br />
<strong>METRO</strong> GROUP to focus on the key drivers of the operating<br />
business that management can influence: increases in operational<br />
efficiency, value-creating growth and the optimisation<br />
of capital employed. The efficiency and value-enhancing programme<br />
Shape 2012 contributes, in particular, to increases<br />
in operational efficiency and the optimisation of capital<br />
employed. value-creating growth, in turn, continues to derive<br />
largely from <strong>METRO</strong> GROUP’s strategy of investing in the<br />
high-margin growth regions of Eastern Europe and Asia.<br />
→ p. 086<br />
The cost of capital reflects the expected remuneration to<br />
investors for the capital they provide and for their investment<br />
risk before taxes. It is calculated by multiplying the<br />
average capital employed by the weighted average cost of<br />
capital before taxes (wACC).<br />
The cost of capital before taxes corresponds to the minimum<br />
return on capital demanded by capital providers. It<br />
reflects the total cost of capital employed and thus consists<br />
of equity and debt capital costs. Previously, the cost<br />
of capital was calculated on the basis of a uniform risk for<br />
all sales divisions. For practical reasons, however, this did<br />
not distinguish between the trade and real estate business;<br />
in addition, the calculation of the wACC for the segments<br />
did not reflect a weighting of country risks. Following<br />
the establishment of the Real Estate segment as an<br />
independent profit centre, <strong>METRO</strong> GROUP adjusted the<br />
capital cost calculation in 2010. This has a significant<br />
impact on corporate controlling. Through the use of riskadequate<br />
capital costs, which are differentiated by countries<br />
and segments, <strong>METRO</strong> GROUP can optimise the allocation<br />
of available investment funds, among other things.<br />
The weighted cost of capital is determined by a risk-free<br />
rate of return, a country-specific risk premium, segmentspecific<br />
business risk and financial risk. The assessment<br />
of the segments’ respective business risk, which is<br />
reflected in the beta factor, was implemented by means of<br />
an analysis of peer companies for the respective sales divisions<br />
and the Real Estate segment. In addition, the new<br />
wACC calculation considers sector-specific financing<br />
structures and explicitly accounts for individual country risks<br />
to calculate the segment wACCs. In 2010, <strong>METRO</strong> GROUP’s<br />
weighted cost of capital before taxes amounted to 9.8 percent.<br />
This figure is calculated from the segment-specific<br />
weighted cost of capital weighted according to capital<br />
employed.<br />
Capital employed represents interest-carrying assets. In<br />
order to further enhance the comprehensibility of the calculation,<br />
the definition of capital employed was spelled out<br />
even more clearly. Capital employed comprises segment<br />
assets plus net working capital less trade payables as well<br />
as deferred liabilities. It principally represents an average<br />
capital employed that is calculated from quarterly financial<br />
statements. One benefit of the use of averages is that the<br />
calculation can consider developments in capital employed<br />
that occur during the relevant period.