pdf (2.5 MB) - METRO Group
pdf (2.5 MB) - METRO Group
pdf (2.5 MB) - METRO Group
Create successful ePaper yourself
Turn your PDF publications into a flip-book with our unique Google optimized e-Paper software.
<strong>METRO</strong> GROUP : ANNUAL REPORT 2010 : BUSINESS<br />
→ NOTES : NOTES TO ThE INCOME STATEMENT<br />
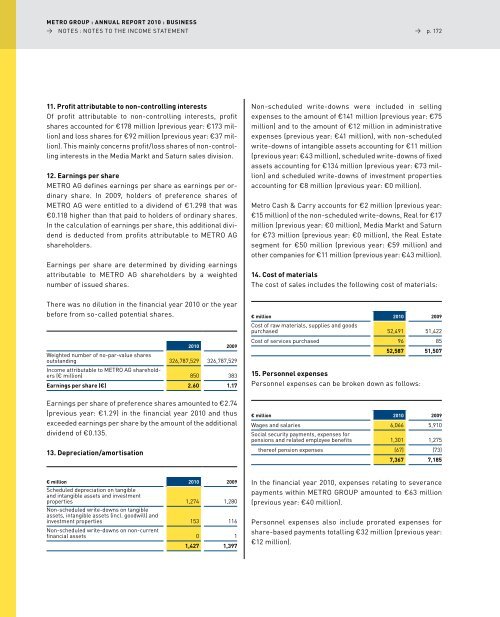
11. Profit attributable to non-controlling interests<br />
Of profit attributable to non-controlling interests, profit<br />
shares accounted for €178 million (previous year: €173 million)<br />
and loss shares for €92 million (previous year: €37 million).<br />
This mainly concerns profit/loss shares of non-controlling<br />
interests in the Media Markt and Saturn sales division.<br />
12. Earnings per share<br />
<strong>METRO</strong> AG defines earnings per share as earnings per ordinary<br />
share. In 2009, holders of preference shares of<br />
<strong>METRO</strong> AG were entitled to a dividend of €1.298 that was<br />
€0.118 higher than that paid to holders of ordinary shares.<br />
In the calculation of earnings per share, this additional dividend<br />
is deducted from profits attributable to <strong>METRO</strong> AG<br />
shareholders.<br />
Earnings per share are determined by dividing earnings<br />
attributable to <strong>METRO</strong> AG shareholders by a weighted<br />
number of issued shares.<br />
There was no dilution in the financial year 2010 or the year<br />
before from so-called potential shares.<br />
2010 2009<br />
Weighted number of no-par-value shares<br />
outstanding<br />
Income attributable to <strong>METRO</strong> AG sharehold-<br />
326,787,529 326,787,529<br />
ers (€ million) 850 383<br />
Earnings per share (€) 2.60 1.17<br />
Earnings per share of preference shares amounted to €2.74<br />
(previous year: €1.29) in the financial year 2010 and thus<br />
exceeded earnings per share by the amount of the additional<br />
dividend of €0.135.<br />
13. Depreciation/amortisation<br />
€ million<br />
Scheduled depreciation on tangible<br />
and intangible assets and investment<br />
2010 2009<br />
properties<br />
Non-scheduled write-downs on tangible<br />
assets, intangible assets (incl. goodwill) and<br />
1,274 1,280<br />
investment properties<br />
Non-scheduled write-downs on non-current<br />
153 116<br />
financial assets 0 1<br />
1,427 1,397<br />
→ p. 172<br />
Non-scheduled write-downs were included in selling<br />
expenses to the amount of €141 million (previous year: €75<br />
million) and to the amount of €12 million in administrative<br />
expenses (previous year: €41 million), with non-scheduled<br />
write-downs of intangible assets accounting for €11 million<br />
(previous year: €43 million), scheduled write-downs of fixed<br />
assets accounting for €134 million (previous year: €73 million)<br />
and scheduled write-downs of investment properties<br />
accounting for €8 million (previous year: €0 million).<br />
Metro Cash & Carry accounts for €2 million (previous year:<br />
€15 million) of the non-scheduled write-downs, Real for €17<br />
million (previous year: €0 million), Media Markt and Saturn<br />
for €73 million (previous year: €0 million), the Real Estate<br />
segment for €50 million (previous year: €59 million) and<br />
other companies for €11 million (previous year: €43 million).<br />
14. Cost of materials<br />
The cost of sales includes the following cost of materials:<br />
€ million<br />
Cost of raw materials, supplies and goods<br />
2010 2009<br />
purchased 52,491 51,422<br />
Cost of services purchased 96 85<br />
52,587 51,507<br />
15. Personnel expenses<br />
Personnel expenses can be broken down as follows:<br />
€ million 2010 2009<br />
Wages and salaries<br />
Social security payments, expenses for<br />
6,066 5,910<br />
pensions and related employee benefits 1,301 1,275<br />
thereof pension expenses (67) (73)<br />
7,367 7,185<br />
In the financial year 2010, expenses relating to severance<br />
payments within <strong>METRO</strong> GROuP amounted to €63 million<br />
(previous year: €40 million).<br />
Personnel expenses also include prorated expenses for<br />
share-based payments totalling €32 million (previous year:<br />
€12 million).


