

A comparative analysis of the US and EU retail banking markets - Wsbi
A comparative analysis of the US and EU retail banking markets - Wsbi
A comparative analysis of the US and EU retail banking markets - Wsbi

Create successful ePaper yourself
Turn your PDF publications into a flip-book with our unique Google optimized e-Paper software.
The existing clearing systems provide clearing <strong>and</strong><br />
settlement services for electronic payment instructions<br />
<strong>and</strong> cheques to a combined total <strong>of</strong> over 11,000<br />
direct <strong>and</strong> indirect participants (not counting third<br />
parties e.g. corporates who may input payment<br />
instructions directly into a system yet under <strong>the</strong><br />
responsibility – “sponsorship” – <strong>of</strong> a direct participant).<br />
In 2004 <strong>the</strong>se systems processed a combined total <strong>of</strong><br />
over 25,6 billion payment instructions for a<br />
combined value <strong>of</strong> €25 trillion (note: no figures were<br />
available for <strong>the</strong> Ne<strong>the</strong>rl<strong>and</strong>s).<br />
6.3.3 Initial considerations as regards<br />
<strong>the</strong> <strong>US</strong> <strong>and</strong> <strong>EU</strong> payments <strong>markets</strong><br />
At first glance any comparison between <strong>the</strong> <strong>US</strong> <strong>and</strong><br />
<strong>EU</strong> payment systems would seem unfair. Indeed, even<br />
if <strong>the</strong> populations concerned are <strong>of</strong> a somewhat<br />
similar size (294 million in <strong>the</strong> <strong>US</strong> vs. 386 million in<br />
<strong>the</strong> <strong>EU</strong>15) this is about comparing payment systems<br />
which have evolved out <strong>of</strong> completely different<br />
historical, legal, regulatory, practice, market <strong>and</strong><br />
pricing structure legacies.<br />
In addition one market has been relying on a single<br />
currency for over 200 years, whereas <strong>the</strong> o<strong>the</strong>r<br />
market has not only – partially – just migrated to a<br />
wholly new, single currency, but also it is not<br />
constituted <strong>of</strong> a single payments market, but <strong>of</strong> <strong>the</strong><br />
consolidation <strong>of</strong> 15 national <strong>markets</strong>, all with <strong>the</strong>ir<br />
own legacies. Never<strong>the</strong>less, drawing a comparison is<br />
tempting, as we are dealing with <strong>the</strong> two largest<br />
cashless payment areas in <strong>the</strong> world, <strong>and</strong> as <strong>the</strong><br />
European Union has embarked on <strong>the</strong> SEPA (or<br />
Single Euro Payments Area) project aimed at<br />
delivering <strong>the</strong> same level <strong>of</strong> ease <strong>and</strong> convenience for<br />
customers regardless <strong>of</strong> <strong>the</strong> location in <strong>the</strong> European<br />
Union where <strong>the</strong>y make <strong>and</strong> receive payments.<br />
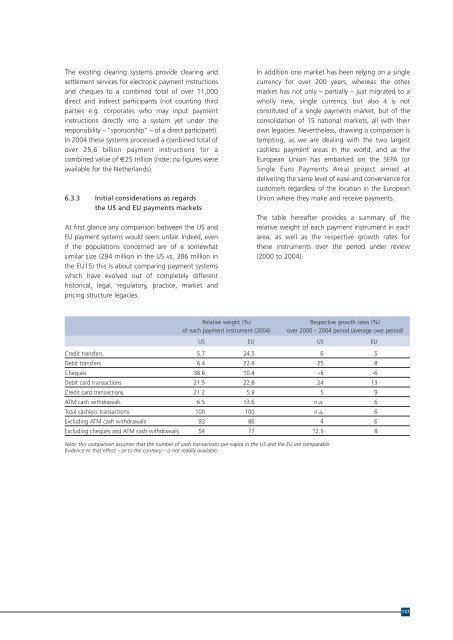
The table hereafter provides a summary <strong>of</strong> <strong>the</strong><br />
relative weight <strong>of</strong> each payment instrument in each<br />
area, as well as <strong>the</strong> respective growth rates for<br />
<strong>the</strong>se instruments over <strong>the</strong> period under review<br />
(2000 to 2004).<br />
Relative weight (%) Respective growth rates (%)<br />
<strong>of</strong> each payment instrument (2004) over 2000 – 2004 period (average over period)<br />
<strong>US</strong> <strong>EU</strong> <strong>US</strong> <strong>EU</strong><br />
Credit transfers 5.7 24.5 6 5<br />
Debit transfers 6.4 22.8 25 8<br />
Cheques 38.6 10.4 -5 -6<br />
Debit card transactions 21.5 22.8 24 13<br />
Credit card transactions 21.2 5.9 5 9<br />
ATM cash withdrawals 6.5 13.6 n.a. 6<br />
Total cashless transactions 100 100 n.a. 6<br />
Excluding ATM cash withdrawals 93 86 4 6<br />
Excluding cheques <strong>and</strong> ATM cash withdrawals 54 77 12.5 8<br />
Note: this comparison assumes that <strong>the</strong> number <strong>of</strong> cash transactions per capita in <strong>the</strong> <strong>US</strong> <strong>and</strong> <strong>the</strong> <strong>EU</strong> are comparable.<br />
Evidence to that effect – or to <strong>the</strong> contrary – is not readily available.<br />
137


