

A comparative analysis of the US and EU retail banking markets - Wsbi
A comparative analysis of the US and EU retail banking markets - Wsbi
A comparative analysis of the US and EU retail banking markets - Wsbi

You also want an ePaper? Increase the reach of your titles
YUMPU automatically turns print PDFs into web optimized ePapers that Google loves.
Relative to population, <strong>the</strong> European Union had 19<br />
institutions for each 1 million heads <strong>of</strong> population in<br />
2003. However, this figure varies significantly from<br />
country to country, ranging from 5 in Greece to 381<br />
institutions per 1 million inhabitants in Luxembourg.<br />
Countries that have below <strong>EU</strong> average number <strong>of</strong><br />
institutions relative to population include <strong>the</strong> UK (7),<br />
Spain (8), Belgium (10), Italy (14) <strong>and</strong> France (16).<br />
5.2.1.2.3 Number <strong>of</strong> branches<br />
The number <strong>of</strong> branches in Europe has increased<br />
from 173,152 branches in 1985 to 186,009 in 2003,<br />
an increase <strong>of</strong> 7.4% (see table 4 below).<br />
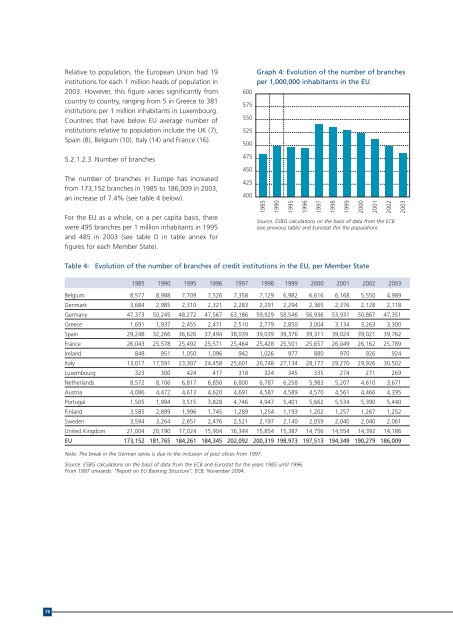
For <strong>the</strong> <strong>EU</strong> as a whole, on a per capita basis, <strong>the</strong>re<br />
were 495 branches per 1 million inhabitants in 1995<br />
<strong>and</strong> 485 in 2003 (see table D in table annex for<br />
figures for each Member State).<br />
Graph 4: Evolution <strong>of</strong> <strong>the</strong> number <strong>of</strong> branches<br />
per 1,000,000 inhabitants in <strong>the</strong> <strong>EU</strong><br />
600<br />
575<br />
550<br />
525<br />
500<br />
475<br />
450<br />
425<br />
400<br />
1985<br />
1990<br />
1995<br />
1996<br />
1997<br />
1998<br />
1999<br />
2000<br />
2001<br />
2002<br />
Source: ESBG calculations on <strong>the</strong> basis <strong>of</strong> data from <strong>the</strong> ECB<br />
(see previous table) <strong>and</strong> Eurostat (for <strong>the</strong> population).<br />
2003<br />
Table 4:<br />
Evolution <strong>of</strong> <strong>the</strong> number <strong>of</strong> branches <strong>of</strong> credit institutions in <strong>the</strong> <strong>EU</strong>, per Member State<br />
1985 1990 1995 1996 1997 1998 1999 2000 2001 2002 2003<br />
Belgium 8,577 8,988 7,709 7,526 7,358 7,129 6,982 6,616 6,168 5,550 4,989<br />
Denmark 3,684 2,985 2,310 2,321 2,283 2,291 2,294 2,365 2,376 2,128 2,118<br />
Germany 47,373 50,245 48,272 47,567 63,186 59,929 58,546 56,936 53,931 50,867 47,351<br />
Greece 1,691 1,937 2,455 2,471 2,510 2,779 2,850 3,004 3,134 3,263 3,300<br />
Spain 29,248 32,266 36,626 37,494 38,039 39,039 39,376 39,311 39,024 39,021 39,762<br />
France 26,043 25,578 25,492 25,571 25,464 25,428 25,501 25,657 26,049 26,162 25,789<br />
Irel<strong>and</strong> 848 951 1,050 1,096 942 1,026 977 880 970 926 924<br />
Italy 13,017 17,591 23,307 24,458 25,601 26,748 27,134 28,177 29,270 29,926 30,502<br />
Luxembourg 323 300 424 417 318 324 345 335 274 271 269<br />
Ne<strong>the</strong>rl<strong>and</strong>s 8,572 8,106 6,817 6,850 6,800 6,787 6,258 5,983 5,207 4,610 3,671<br />
Austria 4,086 4,472 4,613 4,620 4,691 4,587 4,589 4,570 4,561 4,466 4,395<br />
Portugal 1,505 1,994 3,515 3,828 4,746 4,947 5,401 5,662 5,534 5,390 5,440<br />
Finl<strong>and</strong> 3,585 2,899 1,996 1,745 1,289 1,254 1,193 1,202 1,257 1,267 1,252<br />
Sweden 3,594 3,264 2,651 2,476 2,521 2,197 2,140 2,059 2,040 2,040 2,061<br />
United Kingdom 21,004 20,190 17,024 15,904 16,344 15,854 15,387 14,756 14,554 14,392 14,186<br />
<strong>EU</strong> 173,152 181,765 184,261 184,345 202,092 200,319 198,973 197,513 194,349 190,279 186,009<br />
Note: The break in <strong>the</strong> German series is due to <strong>the</strong> inclusion <strong>of</strong> post <strong>of</strong>ices from 1997.<br />
Source: ESBG calculations on <strong>the</strong> basis <strong>of</strong> data from <strong>the</strong> ECB <strong>and</strong> Eurostat for <strong>the</strong> years 1985 until 1996.<br />
From 1997 onwards: "Report on <strong>EU</strong> Banking Structure", ECB, November 2004.<br />
78


