

A comparative analysis of the US and EU retail banking markets - Wsbi
A comparative analysis of the US and EU retail banking markets - Wsbi
A comparative analysis of the US and EU retail banking markets - Wsbi

Create successful ePaper yourself
Turn your PDF publications into a flip-book with our unique Google optimized e-Paper software.
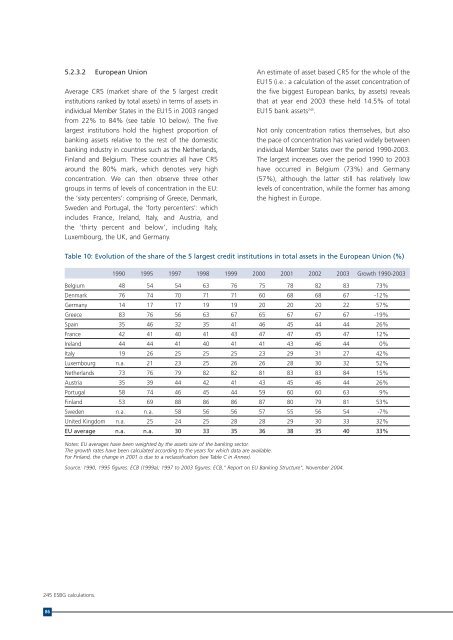
5.2.3.2 European Union<br />
Average CR5 (market share <strong>of</strong> <strong>the</strong> 5 largest credit<br />
institutions ranked by total assets) in terms <strong>of</strong> assets in<br />
individual Member States in <strong>the</strong> <strong>EU</strong>15 in 2003 ranged<br />
from 22% to 84% (see table 10 below). The five<br />
largest institutions hold <strong>the</strong> highest proportion <strong>of</strong><br />
<strong>banking</strong> assets relative to <strong>the</strong> rest <strong>of</strong> <strong>the</strong> domestic<br />
<strong>banking</strong> industry in countries such as <strong>the</strong> Ne<strong>the</strong>rl<strong>and</strong>s,<br />
Finl<strong>and</strong> <strong>and</strong> Belgium. These countries all have CR5<br />
around <strong>the</strong> 80% mark, which denotes very high<br />
concentration. We can <strong>the</strong>n observe three o<strong>the</strong>r<br />
groups in terms <strong>of</strong> levels <strong>of</strong> concentration in <strong>the</strong> <strong>EU</strong>:<br />
<strong>the</strong> ‘sixty percenters’: comprising <strong>of</strong> Greece, Denmark,<br />
Sweden <strong>and</strong> Portugal, <strong>the</strong> ‘forty percenters’: which<br />
includes France, Irel<strong>and</strong>, Italy, <strong>and</strong> Austria, <strong>and</strong><br />
<strong>the</strong> ‘thirty percent <strong>and</strong> below’, including Italy,<br />
Luxembourg, <strong>the</strong> UK, <strong>and</strong> Germany.<br />
An estimate <strong>of</strong> asset based CR5 for <strong>the</strong> whole <strong>of</strong> <strong>the</strong><br />
<strong>EU</strong>15 (i.e.: a calculation <strong>of</strong> <strong>the</strong> asset concentration <strong>of</strong><br />
<strong>the</strong> five biggest European banks, by assets) reveals<br />
that at year end 2003 <strong>the</strong>se held 14.5% <strong>of</strong> total<br />
<strong>EU</strong>15 bank assets 245 .<br />
Not only concentration ratios <strong>the</strong>mselves, but also<br />
<strong>the</strong> pace <strong>of</strong> concentration has varied widely between<br />
individual Member States over <strong>the</strong> period 1990-2003.<br />
The largest increases over <strong>the</strong> period 1990 to 2003<br />
have occurred in Belgium (73%) <strong>and</strong> Germany<br />
(57%), although <strong>the</strong> latter still has relatively low<br />
levels <strong>of</strong> concentration, while <strong>the</strong> former has among<br />
<strong>the</strong> highest in Europe.<br />
Table 10: Evolution <strong>of</strong> <strong>the</strong> share <strong>of</strong> <strong>the</strong> 5 largest credit institutions in total assets in <strong>the</strong> European Union (%)<br />
1990 1995 1997 1998 1999 2000 2001 2002 2003 Growth 1990-2003<br />
Belgium 48 54 54 63 76 75 78 82 83 73%<br />
Denmark 76 74 70 71 71 60 68 68 67 -12%<br />
Germany 14 17 17 19 19 20 20 20 22 57%<br />
Greece 83 76 56 63 67 65 67 67 67 -19%<br />
Spain 35 46 32 35 41 46 45 44 44 26%<br />
France 42 41 40 41 43 47 47 45 47 12%<br />
Irel<strong>and</strong> 44 44 41 40 41 41 43 46 44 0%<br />
Italy 19 26 25 25 25 23 29 31 27 42%<br />
Luxembourg n.a. 21 23 25 26 26 28 30 32 52%<br />
Ne<strong>the</strong>rl<strong>and</strong>s 73 76 79 82 82 81 83 83 84 15%<br />
Austria 35 39 44 42 41 43 45 46 44 26%<br />
Portugal 58 74 46 45 44 59 60 60 63 9%<br />
Finl<strong>and</strong> 53 69 88 86 86 87 80 79 81 53%<br />
Sweden n.a. n.a. 58 56 56 57 55 56 54 -7%<br />
United Kingdom n.a. 25 24 25 28 28 29 30 33 32%<br />
<strong>EU</strong> average n.a. n.a. 30 33 35 36 38 35 40 33%<br />
Notes: <strong>EU</strong> averages have been weighted by <strong>the</strong> assets size <strong>of</strong> <strong>the</strong> <strong>banking</strong> sector.<br />
The growth rates have been calculated according to <strong>the</strong> years for which data are available.<br />
For Finl<strong>and</strong>, <strong>the</strong> change in 2001 is due to a reclassification (see Table C in Annex).<br />
Source: 1990, 1995 figures: ECB (1999a); 1997 to 2003 figures: ECB," Report on <strong>EU</strong> Banking Structure", November 2004.<br />
245 ESBG calculations.<br />
86


