

A comparative analysis of the US and EU retail banking markets - Wsbi
A comparative analysis of the US and EU retail banking markets - Wsbi
A comparative analysis of the US and EU retail banking markets - Wsbi

You also want an ePaper? Increase the reach of your titles
YUMPU automatically turns print PDFs into web optimized ePapers that Google loves.
5.3.1.1.2 Bank assets<br />
Looking at graph 9, it can be seen that loans <strong>and</strong><br />
leases have consistently represented more than half<br />
<strong>of</strong> <strong>the</strong> assets <strong>of</strong> FDIC-insured credit institutions over<br />
<strong>the</strong> years, <strong>and</strong> this proportion has remained steady<br />
throughout. Apart from ‘o<strong>the</strong>r assets’, no significant<br />
change in proportion <strong>of</strong> total assets can be observed<br />
for any <strong>of</strong> <strong>the</strong> different asset classes (figures for<br />
graph 9 can be found in table J <strong>of</strong> <strong>the</strong> table annex).<br />
In terms <strong>of</strong> bank loans to <strong>the</strong> private sector as a<br />
proportion <strong>of</strong> GDP, it can be seen in Table 11 that<br />
in 1980, <strong>the</strong>se represented 35% <strong>of</strong> GDP, while <strong>the</strong><br />
equivalent proportion in 2000 was <strong>of</strong> <strong>the</strong> order <strong>of</strong> 49%.<br />
5.3.1.1.3 Loan composition<br />
As can be seen in graph 10 opposite, lending to<br />
households in 2004 represented more than<br />
two/thirds <strong>of</strong> all lending to <strong>the</strong> private sector, while<br />
<strong>the</strong> remainder <strong>of</strong> lending to <strong>the</strong> private sector was<br />
loans to business. Of lending to households, 88%<br />
was home lending (representing 62% <strong>of</strong> total<br />
lending to <strong>the</strong> private sector), <strong>and</strong> 9% was consumer<br />
lending (representing 6% <strong>of</strong> total lending to <strong>the</strong><br />
private sector). Note that <strong>the</strong>se figures include all<br />
private sector lending, <strong>and</strong> <strong>the</strong>refore not just lending<br />
by credit institutions (figures relating to graph 10 can<br />
be found in <strong>the</strong> table annex in table K).<br />
100%<br />
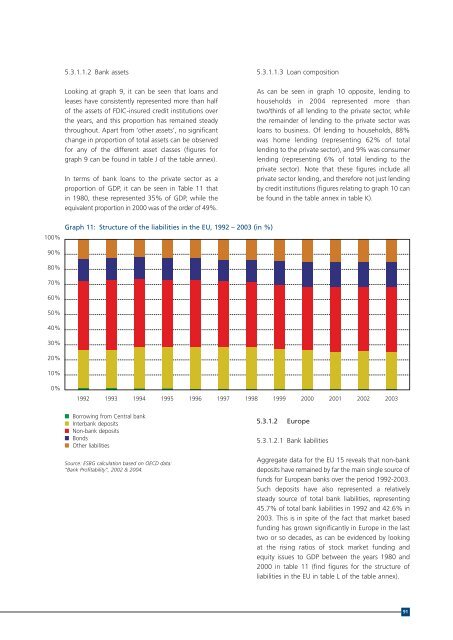
Graph 11: Structure <strong>of</strong> <strong>the</strong> liabilities in <strong>the</strong> <strong>EU</strong>, 1992 – 2003 (in %)<br />
90%<br />
80%<br />
70%<br />
60%<br />
50%<br />
40%<br />
30%<br />
20%<br />
10%<br />
0%<br />
1992 1993 1994 1995 1996 1997 1998 1999 2000 2001 2002 2003<br />
■ Borrowing from Central bank<br />
■ Interbank deposits<br />
■ Non-bank deposits<br />
■ Bonds<br />
■ O<strong>the</strong>r liabilities<br />
Source: ESBG calculation based on OECD data:<br />
“Bank Pr<strong>of</strong>itability”, 2002 & 2004.<br />
5.3.1.2 Europe<br />
5.3.1.2.1 Bank liabilities<br />
Aggregate data for <strong>the</strong> <strong>EU</strong> 15 reveals that non-bank<br />
deposits have remained by far <strong>the</strong> main single source <strong>of</strong><br />
funds for European banks over <strong>the</strong> period 1992-2003.<br />
Such deposits have also represented a relatively<br />
steady source <strong>of</strong> total bank liabilities, representing<br />
45.7% <strong>of</strong> total bank liabilities in 1992 <strong>and</strong> 42.6% in<br />
2003. This is in spite <strong>of</strong> <strong>the</strong> fact that market based<br />
funding has grown significantly in Europe in <strong>the</strong> last<br />
two or so decades, as can be evidenced by looking<br />
at <strong>the</strong> rising ratios <strong>of</strong> stock market funding <strong>and</strong><br />
equity issues to GDP between <strong>the</strong> years 1980 <strong>and</strong><br />
2000 in table 11 (find figures for <strong>the</strong> structure <strong>of</strong><br />
liabilities in <strong>the</strong> <strong>EU</strong> in table L <strong>of</strong> <strong>the</strong> table annex).<br />
91


