

Grain Legumes and Green Manures for Soil Fertility in ... - cimmyt
Grain Legumes and Green Manures for Soil Fertility in ... - cimmyt
Grain Legumes and Green Manures for Soil Fertility in ... - cimmyt

You also want an ePaper? Increase the reach of your titles
YUMPU automatically turns print PDFs into web optimized ePapers that Google loves.
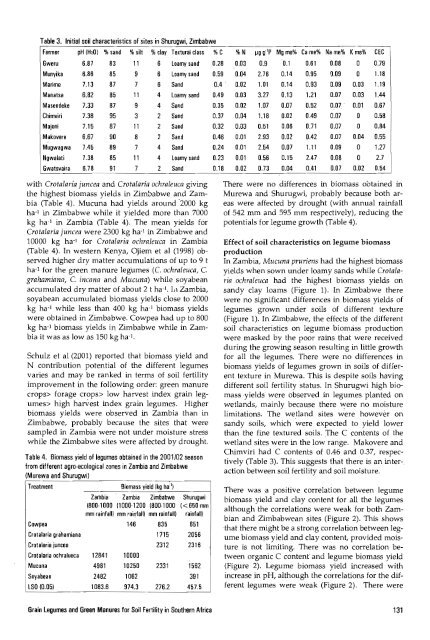
Table 3. Initial soil characteristics of sites <strong>in</strong> Shurugwi. Zimbabwe<br />
Farmer pH (H2O) %s<strong>and</strong> %silt %clay Textural class<br />
Gweru 6.87 83 11 6 Loamy s<strong>and</strong><br />
Munyika 6.86 85 9 6 Loamy s<strong>and</strong><br />
Marime 7.13 87 7 6 S<strong>and</strong><br />
Manatsa 6.82 85 11 4 Loamy s<strong>and</strong><br />
Masendeke 7.33 87 9 4 S<strong>and</strong><br />
Chimviri 7.38 95 3 2 S<strong>and</strong><br />
Majoni 7.15 87 11 2 S<strong>and</strong><br />
Makovere 6.67 90 8 2 S<strong>and</strong><br />
Mugwagwa 7.45 89 7 4 S<strong>and</strong><br />
Ngwalati 7.38 85 11 4 Loamy s<strong>and</strong><br />
Gwatsvaira 6.78 91 7 2 S<strong>and</strong><br />
%C %N j.Jg g.lp Mgme% Ca me% Na me% K me% CEC<br />
0.28 0.03 0.9 0.1 0.61 0.08 0 0.79<br />
0.59 0.04 2.76 0.14 0.95 a.09 0 1.18<br />
0.4 . 0.02 1.01 0.14 0.93 0.09 0.03 1.19<br />
0.49 0.03 3.27 0.13 1.21 0.07 0.03 1.44<br />
0.35 0.02 1.07 0.07 0.52 0.07 . 0.01 0.67<br />
0.37 0.04 1.18 0.02 0.49 0.07 0 0.58<br />
0.32 0.03 0.51 0.06 0.71 0.07 0 0.84<br />
0.46 0.01 2.93 0.02 0.42 0.07 0.04 0.55<br />
0.24 0.01 2.54 0.07 1.11 0.09 0 1.27<br />
0.23 0.01 0.56 0.15 2.47 0.08 0 2.7<br />
0.18 0.02 0.73 0.04 0.41 0.07 0.02 0.54<br />
with Crotalaria juncea <strong>and</strong> Crotalaria ochraleuca giv<strong>in</strong>g<br />
the highest biomass yields <strong>in</strong> Zim!:>abwe <strong>and</strong> Zambia<br />
(Table 4). Mucuna had yields around ·2000 kg<br />
ha·J <strong>in</strong> Zimbabwe while it yielded more than 7000<br />
kg ha·J <strong>in</strong> Zambia (Table 4). The mean yields <strong>for</strong><br />
Crotalaria juncea were 2300 kg ha·J <strong>in</strong> Zimbabwe <strong>and</strong><br />
10000 kg ha·J <strong>for</strong> Crotalaria ochraleuca <strong>in</strong> Zambia<br />
(Table 4). In western Kenya, Ojiem et al (1998) observed<br />
higher dry matter accumulations of up to 9 t<br />
ha- J <strong>for</strong> the green manure legumes (C ochraleuca, C<br />
grahamiana, C <strong>in</strong>cana <strong>and</strong> Mucuna) while soyabean<br />
accumulated dry matter of about 2 t ha· 1• 1,\ Zambia,<br />
soyabean accumulated biomass yields close to 2000<br />
kg ha-] while less than 400 kg ha·J biomass yields<br />
were obta<strong>in</strong>ed <strong>in</strong> Zimbabwe. Cowpea had up to 800<br />
kg ha·J biomass yields <strong>in</strong> Zimbabwe while <strong>in</strong> Zambia<br />
it was as low as 150 kg ha·1.<br />
Schulz et al (2001) reported that biomass yield <strong>and</strong><br />
N contribution potential of the different legumes<br />
varies <strong>and</strong> may be ranked <strong>in</strong> terms of soil fertility<br />
improvement <strong>in</strong> the follow<strong>in</strong>g order: green manure<br />
crops> <strong>for</strong>age crops> low harvest <strong>in</strong>dex gra<strong>in</strong> legumes><br />
high harvest <strong>in</strong>dex gra<strong>in</strong> legumes. Higher<br />
biomass yields were observed <strong>in</strong> Zambia than <strong>in</strong><br />
Zimbabwe, probably because the sites that were<br />
sampled <strong>in</strong> Zambia were not under moisture stress<br />
while the Zimbabwe sites were affected by drought.<br />
Table 4. Biomass yield of legumes obta<strong>in</strong>ed <strong>in</strong> the 2001/02 season<br />
from different agro·ecological zones <strong>in</strong> Zambia <strong>and</strong> Zimbabwe<br />
(Murewa <strong>and</strong> Shurugwi)<br />
Treatment Biomass yield (kg ha· 1 )<br />
Zambia Zambia Zimbabwe Shurugwi<br />
(800·1000 (1000·1200 (800·1000 « 650 mm<br />
mm ra<strong>in</strong>fall) mm ra<strong>in</strong>fall) mm ra<strong>in</strong>fall) ra<strong>in</strong>fall)<br />
Cowpea 146 835 651<br />
Crotalaria gnihamiana 1715 2056<br />
Crotalaria juncea 2312 2316<br />
Crotalaria ochralueca 12841 10000<br />
Mucuna 4981 10250 2331 1562<br />
Soyabean 2482 1062 391<br />
LSO (0.05) 1083.6 974.3 276.2 457.5<br />
There were no differences <strong>in</strong> biomass oota<strong>in</strong>ed <strong>in</strong><br />
Murewa <strong>and</strong> Shurugwi; probably because both areas<br />
were affected by drought (with annual ra<strong>in</strong>fall<br />
of 542 mm <strong>and</strong> 595 mm respectively), reduc<strong>in</strong>g the<br />
potentials <strong>for</strong> legume growth (Table 4).<br />
Effect of soil characteristi


