Grain Legumes and Green Manures for Soil Fertility in ... - cimmyt
Grain Legumes and Green Manures for Soil Fertility in ... - cimmyt
Grain Legumes and Green Manures for Soil Fertility in ... - cimmyt
You also want an ePaper? Increase the reach of your titles
YUMPU automatically turns print PDFs into web optimized ePapers that Google loves.
<strong>in</strong>cremental costs <strong>and</strong> benefits associated with<br />
mucuna as a green manure technology.<br />
The 'without' technology scenario was def<strong>in</strong>ed as<br />
grow<strong>in</strong>g maize cont<strong>in</strong>uously <strong>for</strong> three years without<br />
use of any soil fertility <strong>in</strong>tervention, a practice that<br />
has become common among many poor<br />
smallholder farmers <strong>in</strong> Malawi <strong>and</strong> Zimbabwe. The<br />
'with' technology deals with a mucuna-maize-maize<br />
3-year crop rotation.<br />
The <strong>in</strong>cremental costs <strong>for</strong> us<strong>in</strong>g mucuna are<br />
perceived to be different <strong>for</strong> farmers who are able to<br />
fallow some portions of their field <strong>and</strong> those who<br />
are not able to do so due to l<strong>and</strong> constra<strong>in</strong>t. For<br />
those who fallow l<strong>and</strong>, the <strong>in</strong>cremental costs are<br />
additional labour <strong>and</strong> seed costs associated with<br />
grow<strong>in</strong>g mucuna. For farmers who have to <strong>for</strong>go<br />
maize production on the portion of their l<strong>and</strong><br />
planted to mucuna <strong>in</strong> the <strong>in</strong>vestment year, the<br />
<strong>in</strong>cremental cost is the opportunity cost <strong>in</strong> terms of<br />
value of <strong>for</strong>gone maize production. Benefits were<br />
measured as the value of the <strong>in</strong>cremental maize<br />
gra<strong>in</strong> yields <strong>in</strong> the subsequent two seasons which<br />
was derived as the difference between cont<strong>in</strong>uously<br />
cropped maize yields <strong>and</strong> the maize yield after<br />
mucuna <strong>in</strong>corporation. To value the costs <strong>and</strong><br />
benefits of mucuna, 1999 market prices of <strong>in</strong>puts<br />
<strong>and</strong> outputs <strong>in</strong> both countries were used (see<br />
Appendix 2).<br />
NPV<br />
The. Net Present Value (NPV) was used to quantify<br />
the net f<strong>in</strong>ancial ga<strong>in</strong>s to farmers <strong>for</strong> <strong>in</strong>vest<strong>in</strong>g <strong>in</strong><br />
mucuna. NPV is the djfference between the sum of<br />
discounted benefits (<strong>in</strong>cremental maize yields <strong>in</strong><br />
two seasons) <strong>and</strong> the sum of discounted costs (cost<br />
of mucuna production/<strong>for</strong>gone maize gra<strong>in</strong><br />
harvest). NPV is an absolute measure of the present<br />
worth of an <strong>in</strong>come stream accru<strong>in</strong>g to the<br />
<strong>in</strong>dividual farmers; which is what the farmers are<br />
more <strong>in</strong>terested <strong>in</strong> (Gitt<strong>in</strong>ger, 1982).<br />
The NPV was calculated per one hectare unit of<br />
l<strong>and</strong>. If NPV is greater than zero it is worthwhile<br />
<strong>in</strong>vest<strong>in</strong>g <strong>in</strong> mucuna <strong>and</strong> if it is less than zero it is<br />
not worthwhile <strong>in</strong>vest<strong>in</strong>g <strong>in</strong> mucuna. The larger the<br />
value of NPV· the higher the f<strong>in</strong>ancial returns to<br />
<strong>in</strong>vest<strong>in</strong>g <strong>in</strong> mucuna.<br />
Sensitivity <strong>and</strong> Risk Analysis<br />
Sensitivity analysis shows to what extent the returns<br />
(NPV) to <strong>in</strong>vest<strong>in</strong>g <strong>in</strong> mucuna is <strong>in</strong>fluenced by<br />
variations <strong>in</strong> the major quantifiable elemerits. This<br />
is important <strong>for</strong> identify<strong>in</strong>g those elements whose<br />
changes have the largest impact on viability of the<br />
technology. Monitor<strong>in</strong>g <strong>and</strong> management of such<br />
elements is critical <strong>in</strong> ensur<strong>in</strong>g viability of the technology.<br />
<strong>Gra<strong>in</strong></strong> legumes <strong>and</strong> <strong>Green</strong> <strong>Manures</strong> <strong>for</strong> <strong>Soil</strong> Fertilitv <strong>in</strong> Southern Africa<br />
Risk analysis shows th~ probability out-comes af the<br />
NPV derived from the changes <strong>in</strong> its elements. The<br />
probability that the NPV would be negative can be<br />
used as an <strong>in</strong>dieator of the degree of risk <strong>in</strong> adopt<strong>in</strong>g<br />
the technology.<br />
Both sensi tivity <strong>and</strong> risk analysis were perfomied<br />
us<strong>in</strong>g @RISK (a risk analysis software). @RISK uses<br />
distribution functions <strong>in</strong>stead of constant values<br />
<strong>and</strong> can simulate 1000s of possible outcomes of<br />
NPV. Because of a lack of historic data, triangular<br />
distributions were used to estimate the distribution<br />
functions of all the parameters used <strong>in</strong> comput<strong>in</strong>g<br />
NPV (see Appendix 3).<br />
In sensitivity analysis the regression <strong>and</strong> correlation<br />
coefficients <strong>for</strong> the relationship between the changes<br />
<strong>in</strong> NPVs <strong>and</strong> changes <strong>in</strong> the cost <strong>and</strong> benefit elements<br />
are computed. The larger the regression coefficient<br />
of an NPV element · the more important it is<br />
<strong>in</strong> account<strong>in</strong>g <strong>for</strong> changes <strong>in</strong> the expected NPV. The<br />
correlation coefficient simply shows the nature of<br />
the relationship (positive or negative) between<br />
changes <strong>in</strong> expected NPV <strong>and</strong> the element. In fisk<br />
analysis, a cumulative distribution curve <strong>for</strong> the<br />
simulated NVP outcomes is generated.<br />
Results<br />
F<strong>in</strong>ancial Incentives<br />
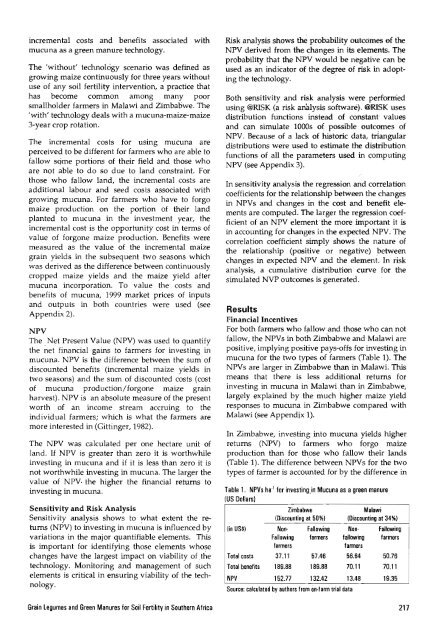
For both farmers who fallow <strong>and</strong> those who can not<br />
fallow, the NPVs <strong>in</strong> both Zirrlbabwe <strong>and</strong> Malawi are<br />
positive, imply<strong>in</strong>g positive pays-offs .<strong>for</strong> <strong>in</strong>vest<strong>in</strong>g <strong>in</strong><br />
mucuna <strong>for</strong> the two types of farmers (Table 1). The<br />
NPV s are larger <strong>in</strong> Zimbabwe than <strong>in</strong> Malawi. This<br />
means that there is less additional returns <strong>for</strong><br />
<strong>in</strong>vest<strong>in</strong>g <strong>in</strong> mucuna <strong>in</strong> Malawi than <strong>in</strong> Zimbabwe,<br />
largely expla<strong>in</strong>ed by the much higher maize yield<br />
responses to mucuna <strong>in</strong> Zimbabwe compared with<br />
Malawi (see Appendix 1).<br />
In Zimbabwe, <strong>in</strong>vest<strong>in</strong>g <strong>in</strong>to mucuna yields higher<br />
returns (NPV) to farmers who <strong>for</strong>go maize<br />
production than <strong>for</strong> those who fallow their l<strong>and</strong>s<br />
(Table 1). The difference between NPVs <strong>for</strong> the two<br />
types of farmer is accounted <strong>for</strong> by the difference <strong>in</strong><br />
Table 1. NPVs hal <strong>for</strong> <strong>in</strong>vest<strong>in</strong>g,<strong>in</strong> Mucuna as agreen manure<br />
(US Dollars)<br />
Zimbabwe<br />
Malawi<br />
(Discount<strong>in</strong>g at 50%) (Discount<strong>in</strong>g .at 34%)<br />
(<strong>in</strong> US$) Non· Fallow<strong>in</strong>g Non· Fallow<strong>in</strong>g<br />
Fallow<strong>in</strong>g farmers fallow<strong>in</strong>g farmers<br />
farmers<br />
farmers<br />
Total costs 37.11 57.46 56.64 50.76<br />
Total benefits 189.88 189.88 7a.ll 70.11<br />
NPV 152.77 132.42 13.48 19.35<br />
Source: calculated by authors from on·farm trial data<br />
217


