

Grain Legumes and Green Manures for Soil Fertility in ... - cimmyt
Grain Legumes and Green Manures for Soil Fertility in ... - cimmyt
Grain Legumes and Green Manures for Soil Fertility in ... - cimmyt

You also want an ePaper? Increase the reach of your titles
YUMPU automatically turns print PDFs into web optimized ePapers that Google loves.
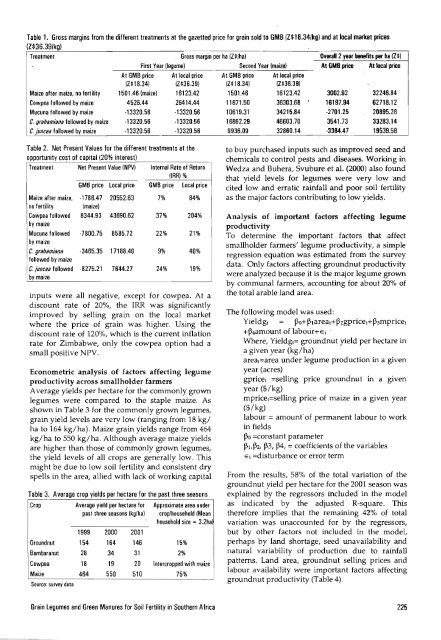
Table 1. Gross marg<strong>in</strong>s from the different treatments at the gazetted price <strong>for</strong> gra<strong>in</strong> sold to GMB (Z$18.34/kg) <strong>and</strong> at local market prices<br />
(Z$36.39/kg)<br />
Treatment Gross marg<strong>in</strong> per ha (Z$lha) Overa. 2 year benefits per ha (Z $)<br />
First Year (legume)<br />
Second Year (maize) At GMBprice At local price<br />
At GMB price At local price<br />
(Z$18.34) (Z$36.39)<br />
Maize after maize. no fertility 1501.46 (maize) 16123.42<br />
Cowpea followed by maize 4526.44 26414.44<br />
Mucuna followed by maize ·13320.56 ·13320.56<br />
C. grahamiana followed by maize ·13320.56 ·13320.56<br />
C. juncea followed by maize ·13320.56 ·13320.56<br />
At GMB price At local price<br />
(Z$18.34) (Z$36.39)<br />
1501.46 16123.42 3002.92 32246.84 '<br />
11671.50 36303.68<br />
. 16197.94 62718.12<br />
10619.31 34215.84 ·2701.25 20895.28<br />
16862.29 46603.70 3541.73 33283.14<br />
9936.09 32860.14 -3384.47 19.539.58<br />
Table 2. Net Present Values <strong>for</strong> the different treatments at the<br />
opportunity cost of capital (20% <strong>in</strong>terest)<br />
Treatment Net Present Value (NPV) Internal Rate of Return<br />
(lRR) %<br />
GMB price Local price GMB price Local price<br />
Maize after maize. ·1786.47 20552.63 7% 84%<br />
no fertility<br />
(maize)<br />
Cowpea followed 8344.93 43690.62 37% 204%<br />
by maize<br />
Mucuna followed ·7800.75 8585.72 22% 21%<br />
by maize<br />
C. grahamiana ·3465.35 17188.40 9% 40% <br />
followed by maize <br />
IC. juncea followed ·8275.21 7644.27 24% 19%<br />
by maize<br />
<strong>in</strong>puts were all negative, except <strong>for</strong> cowpea. At a<br />
discount rate of 20%, the IRR was significantly<br />
improved by sell<strong>in</strong>g gra<strong>in</strong> on the local market<br />
where the price of gra<strong>in</strong> was higher. Us<strong>in</strong>g the<br />
discount rate of 120%, which is the current <strong>in</strong>flation<br />
rate <strong>for</strong> Zimbabwe, only the cowpea option had a<br />
small positive NPV.<br />
Econometric analysis of factors affect<strong>in</strong>g legume<br />
productivity across smallholder farmers<br />
A verage yields per hectare <strong>for</strong> the commonly grown<br />
legumes were compared to the staple maize. As<br />
shown <strong>in</strong> Table 3 <strong>for</strong> the commonly grown legumes,<br />
gra<strong>in</strong> yield levels are very low (rang<strong>in</strong>g from 18 kg/<br />
ha to 164 kg/ha). Maize gra<strong>in</strong> yields range from 464<br />
kg/ha to 550 kg/ha. Although average maize yields<br />
are higher than those of commonly grown legumes,<br />
the yield levels of all crops are generally low. This<br />
might be due to low soil fertility <strong>and</strong> consistent dry<br />
spells <strong>in</strong> the area, allied with lack of work<strong>in</strong>g capital<br />
Table 3. Average crop yields per hectare <strong>for</strong> the past three seasons<br />
Crop Average yield per hectare <strong>for</strong> Approximate area under<br />
past three seasons (kglha) croplhousehold (Mean<br />
household size - 3.2ha<br />
1999 2000 2001<br />
Groundnut 154 164 146 15%<br />
Bambaranut 28 34 31 2%<br />
Cowpea 18 19 20 Intercropped with maize<br />
Maize 464 550 510 75%<br />
Source: survey data<br />
to buy purchased <strong>in</strong>puts such as imptoved seed <strong>and</strong><br />
chemicals to control pests <strong>and</strong> diseaseS. Work<strong>in</strong>g <strong>in</strong><br />
Wedza <strong>and</strong> Buhera, Svubure et al. (2000) also found<br />
that yield levels <strong>for</strong> legumes were very low <strong>and</strong><br />
cited low <strong>and</strong> erratic ra<strong>in</strong>fall -<strong>and</strong> poor soil fertility<br />
as the major factors contribut<strong>in</strong>g to low yields.<br />
Analysis of important factors affect<strong>in</strong>g legume<br />
productivity<br />
To determ<strong>in</strong>e the important factors that affect<br />
smallholder farmers' legume productivity, a simple<br />
regression equation was estimated from the survey<br />
data. Only factors affect<strong>in</strong>g groundnut productivity<br />
were analyzed because it is the major legume grown<br />
by communal farmers, account<strong>in</strong>g <strong>for</strong> about 20% of<br />
the total arable l<strong>and</strong> area.<br />
The follow<strong>in</strong>g model was used:<br />
Yieldgt = po+plareat+p2gpricet+p3mpricet<br />
+p4amount of labotir+ E i .<br />
Where, Yieldgt= groundnut yield per hectare <strong>in</strong><br />
a given year (kg/ha)<br />
areat=area under legume production <strong>in</strong> a given<br />
year (acres)<br />
gpricet =sell<strong>in</strong>g price groundnut <strong>in</strong> a given<br />
year ($/kg)<br />
mpricet=sell<strong>in</strong>g price of maize <strong>in</strong> a given year<br />
($/kg)<br />
labour = amount" of permanent labour to work<br />
<strong>in</strong> fields<br />
po =constant parameter<br />
PI,P2, P3, p4, = coefficients of the variables<br />
Ei =disturbance or etror term<br />
From the results, 58% of the total variation of the<br />
groundnut yield per hectare <strong>for</strong> the 2001 season was<br />
expla<strong>in</strong>ed by the regressors <strong>in</strong>cluded <strong>in</strong> the model<br />
as <strong>in</strong>dicated by the adjusted R-square. This<br />
there<strong>for</strong>e implies that the rema<strong>in</strong><strong>in</strong>g 42% of total<br />
variation was unaccounted <strong>for</strong> by the regressors,<br />
but by other factors not <strong>in</strong>cluded <strong>in</strong> the model,<br />
perhaps by l<strong>and</strong> shortage, seed unavailability <strong>and</strong><br />
natural variability of production due to ra<strong>in</strong>fall<br />
patterns. L<strong>and</strong> atea, groundnut sell<strong>in</strong>g prices <strong>and</strong><br />
labour availability were important factors affect<strong>in</strong>g<br />
groundnut productivity (Table 4).<br />
<strong>Gra<strong>in</strong></strong> legumes <strong>and</strong> <strong>Green</strong> <strong>Manures</strong> <strong>for</strong> <strong>Soil</strong> <strong>Fertility</strong> <strong>in</strong> Southern Africa<br />
225


