

Grain Legumes and Green Manures for Soil Fertility in ... - cimmyt
Grain Legumes and Green Manures for Soil Fertility in ... - cimmyt
Grain Legumes and Green Manures for Soil Fertility in ... - cimmyt

Create successful ePaper yourself
Turn your PDF publications into a flip-book with our unique Google optimized e-Paper software.
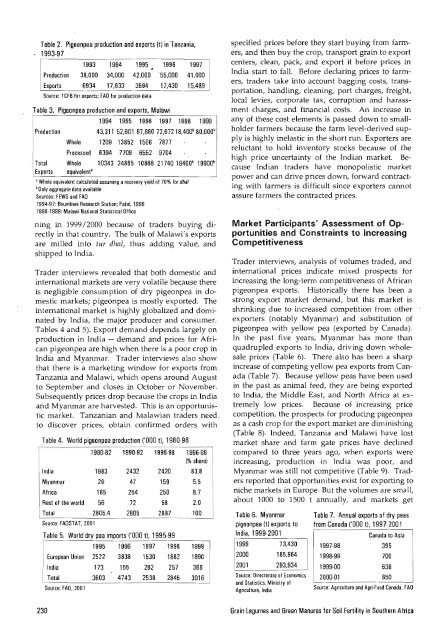
Table 2. Pigeonpea production <strong>and</strong> exports (t) <strong>in</strong> Tanzania,<br />
1993·97<br />
1993 1994<br />
Production 38,000 34,000<br />
1995 1996<br />
42,000 '55,000<br />
Exports 6934 17,633 3594 17,430<br />
Source: TCFB <strong>for</strong> exports; FAD <strong>for</strong> production data<br />
Table 3. Pigeonpea production <strong>and</strong> exports, Malawi<br />
1997<br />
41,000<br />
15,489<br />
1994 1995 1996 1997 1998 1999<br />
Production 43,311 52,601 87,880 72.67218,400b 80,000b<br />
Whole 1209 13852 1506 7877<br />
Processed 6394 7709 6552 9704<br />
Total Whole 10343 24865 10866 21740 18400 b 19600 b<br />
Exports equivalent'<br />
• Whole equivalent calculated assum<strong>in</strong>g arecovery yield of 70% <strong>for</strong> dhill<br />
b Only aggregate data available<br />
Sources: FEWS <strong>and</strong> FAD<br />
1994·97: Bvumbwe Research Station; Patel, 1998<br />
1998·1999: Malawi National Statistical Office<br />
n<strong>in</strong>g <strong>in</strong> 1999/2000 because of traders buy<strong>in</strong>g directly<br />
<strong>in</strong> that country. The bulk of Malawi's exports<br />
are milled <strong>in</strong>to fur dhal, thus add<strong>in</strong>g value, <strong>and</strong><br />
shipped to India.<br />
Trader <strong>in</strong>terviews revealed that both domestic <strong>and</strong><br />
<strong>in</strong>ternational markets are very volatile because there<br />
is negligible consumption of dry pigeonpea <strong>in</strong> domestic<br />
markets; pigeonpea is mostly exported. The<br />
<strong>in</strong>ternational market is highly globalized <strong>and</strong> dom<strong>in</strong>ated<br />
by India, the major producer <strong>and</strong> consumer.<br />
Tables 4 <strong>and</strong> 5). Export dem<strong>and</strong> depends largely on<br />
production <strong>in</strong> India -- dem<strong>and</strong> <strong>and</strong> prices <strong>for</strong> African<br />
pigeonpea are high when there is a poor crop <strong>in</strong><br />
India <strong>and</strong> Myanmar. Trader <strong>in</strong>terviews also show<br />
that there is a market<strong>in</strong>g w<strong>in</strong>dow <strong>for</strong> exports from<br />
Tanzania <strong>and</strong> Malawi, which opens around August<br />
to September <strong>and</strong> closes <strong>in</strong> October or November.<br />
Subsequently prices drop because the crops <strong>in</strong> India<br />
<strong>and</strong> Myanmar are harvested. This is an opportunistic<br />
market. Tanzanian <strong>and</strong> 'Malawian traders need.<br />
to discover prices, obta<strong>in</strong> confirmed orders with<br />
Table 4. World pigeonpea production ('000 t), 1980·98<br />
1980·82 1990·92 1996·98 1996·98<br />
1% share)<br />
India 1983 2432 2420 83.8<br />
Myanmar 29 47 159 5.5<br />
Africa 165 254 250 8.7<br />
Rest of the world 56 72 58 2.0<br />
Total 2805.4 2805 2887 100<br />
Source: FADSTAT. 2001<br />
Table 5. World dry pea imports ('000 t), 1995·99<br />
1995 1996 1997 1998 1999<br />
European Union 2522 3838 1530 1882 1890<br />
India 173 155 282 257 366<br />
Total 3603 4743 2538 2845 3016<br />
Source: FAD. 2001<br />
specified prices be<strong>for</strong>e they start buy<strong>in</strong>g from farmers,<br />
<strong>and</strong> then buy the crop, transport gra<strong>in</strong> to export<br />
centers, clean, pack, <strong>and</strong> export it be<strong>for</strong>e prices <strong>in</strong><br />
India start to fall. Be<strong>for</strong>e declar<strong>in</strong>g prices to farmers,<br />
traders take <strong>in</strong>to account bagg<strong>in</strong>g costs, transportation,<br />
h<strong>and</strong>l<strong>in</strong>g, clean<strong>in</strong>g, port charges, freight,<br />
local levies, corporate tax, corruption <strong>and</strong> harassment<br />
charges, <strong>and</strong> f<strong>in</strong>ancial costs. An <strong>in</strong>crease <strong>in</strong><br />
any of these cost elements is passed down to smallholder<br />
farmers because the farm level-derived supply<br />
is highly <strong>in</strong>elastic <strong>in</strong> the short run. Exporters are<br />
reluctant to hold <strong>in</strong>ventory stocks because of the<br />
high price uncerta<strong>in</strong>ty of the Indian market. Because<br />
Indian traders have monopolistic market<br />
power <strong>and</strong> can drive prices down, <strong>for</strong>ward contract<strong>in</strong>g<br />
with farmers is difficult s<strong>in</strong>ce exporters cannot<br />
assure farmers the contracted prices.<br />
Market Participants' Assessment of Opportunities<br />
<strong>and</strong> Constra<strong>in</strong>ts to Increas<strong>in</strong>g<br />
Competitiveness<br />
Trader <strong>in</strong>terviews, analysis of volumes traded, <strong>and</strong><br />
<strong>in</strong>ternational prices <strong>in</strong>dicate mixed prospects <strong>for</strong><br />
<strong>in</strong>creas<strong>in</strong>g the long-term competitiveness of African<br />
pigeonpea exports. Historically there has been a<br />
strong export market dem<strong>and</strong>, but this market is<br />
shr<strong>in</strong>k<strong>in</strong>g due to <strong>in</strong>creased competition from other<br />
exporters (notably Myanmar) <strong>and</strong> substitution of<br />
pigeonpea with yellow pea (exported by Canada).<br />
In the past five years, Myanmar has more than<br />
quadrupled exports to India, driv<strong>in</strong>g down wholesale<br />
prices (Table 6). There also has been a sharp<br />
<strong>in</strong>crease of compet<strong>in</strong>g yellow pea exports from Canada<br />
(Table 7). Because yellow peas have been used<br />
<strong>in</strong> the past as animal feed, they are be<strong>in</strong>g exported<br />
to India, the Middle East, <strong>and</strong> North Africa at extremely<br />
low prices. Because of. <strong>in</strong>creas<strong>in</strong>g price<br />
competition, the prospects <strong>for</strong> produc<strong>in</strong>g pigeon pea<br />
as a cash crop <strong>for</strong> the export market are dim<strong>in</strong>ish<strong>in</strong>g<br />
(Table 8). hldeed, Tanzania <strong>and</strong> Malawi have lost<br />
market share <strong>and</strong> farm gate prices have decl<strong>in</strong>ed<br />
compared to three years ago, when exports were<br />
<strong>in</strong>creas<strong>in</strong>g, production <strong>in</strong> India was poor, <strong>and</strong><br />
Myanmar was still not competitive (Table 9). Traders<br />
reported that opportunities exist <strong>for</strong> export<strong>in</strong>g to<br />
niche markets <strong>in</strong> Europe. But the volumes are small,<br />
about 1000 to 1500 t annually, <strong>and</strong> markets get<br />
Table 6. Myanmar Table 7. Annual exports of dry peas<br />
pigeonpea (I) exports to from Canada ('000 t), 1997·2001<br />
India, 1999·2001<br />
Canada to Asia<br />
1999 73,430 1997·98 395 <br />
2000 185,964 1998·99 700 <br />
2001 293,934 1999·00 638<br />
Source: Directorate of Economics 2000·01 850<br />
<strong>and</strong> Statistics. M<strong>in</strong>istry of<br />
Agriculture, India<br />
Source: Agriculture <strong>and</strong> Agri·Food Canada, FAO<br />
230<br />
<strong>Gra<strong>in</strong></strong> <strong>Legumes</strong> <strong>and</strong> <strong>Green</strong> <strong>Manures</strong> <strong>for</strong> <strong>Soil</strong> <strong>Fertility</strong> <strong>in</strong> Southern Africa


