

Grain Legumes and Green Manures for Soil Fertility in ... - cimmyt
Grain Legumes and Green Manures for Soil Fertility in ... - cimmyt
Grain Legumes and Green Manures for Soil Fertility in ... - cimmyt

Create successful ePaper yourself
Turn your PDF publications into a flip-book with our unique Google optimized e-Paper software.
3500<br />
.f"'3000<br />
ca<br />
,c2500<br />
CI<br />
"" - 2000<br />
.PO<br />
~<br />
'ti<br />
>. 1500 • MAP<br />
.PAPR<br />
c 1000<br />
~<br />
(!) 500<br />
0<br />
o 40 80 120 160 200<br />
P level (kg P 2 0 S ha- 1 )<br />
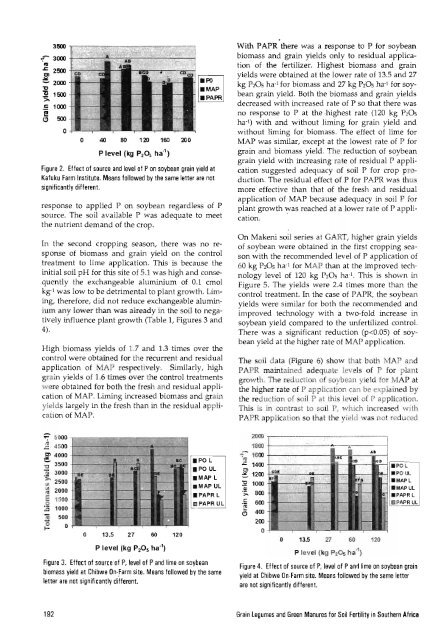
Figure 2_ Effect of source <strong>and</strong> level of P on soybean gra<strong>in</strong> yield at<br />
Kafuku Farm Institute. Means followed by the same letter are not<br />
significantly different.<br />
response to applied P on soybean regardless of P<br />
source. The soil available P was adequate to meet<br />
the nutrient dem<strong>and</strong> of the crop.<br />
In the second cropp<strong>in</strong>g season, there was no response<br />
of biomass <strong>and</strong> gra<strong>in</strong> yield on the control<br />
treatment to lime application. This is because the<br />
<strong>in</strong>itial soil pH <strong>for</strong> this site of 5.1 was high <strong>and</strong> consequently<br />
the exchangeable alum<strong>in</strong>ium of 0.1 cmol<br />
kg-I was low to be detrimental to plant growth. Lim<strong>in</strong>g,<br />
there<strong>for</strong>e, did not reduce exchangeable alum<strong>in</strong>ium<br />
any lower than was already <strong>in</strong> the soil to negatively<br />
<strong>in</strong>fluence plant growth (Table I, Figures 3 <strong>and</strong><br />
4).<br />
High biomass yields of 1.7 <strong>and</strong> 1.3 times over the<br />
control were obta<strong>in</strong>ed <strong>for</strong> the recurrent <strong>and</strong> residual<br />
appiication of MAP respectively. Similarly, high<br />
gra<strong>in</strong> yields of 1.6 times over the control treatments<br />
were obta<strong>in</strong>ed <strong>for</strong> both the fresh <strong>and</strong> residual application<br />
of MAP. Lim<strong>in</strong>g <strong>in</strong>creased biomass <strong>and</strong> gra<strong>in</strong><br />
yields largely <strong>in</strong> the fresh than <strong>in</strong> the residual application<br />
of MAP.<br />
;::-- 5000 ,...,~=-.........~~----_~~<br />
~ . 4500 .1--------.......",~----4;,..-~<br />
~ 4000<br />
;- 3500<br />
Qj 3000<br />
': 2500<br />
~ 2000<br />
E 1500<br />
.S!<br />
..0 1000<br />
500<br />
-tV<br />
0 0<br />
~<br />
o 13.5 27 60 120<br />
P level (kg P 2<br />
0 S ha- 1 )<br />
.PO L<br />
.1'0 UL<br />
.MAP L<br />
.MAP UL<br />
• PAPR L<br />
ill PAPR UL<br />
Figure 3. Effect of source of P, level of P<strong>and</strong> lime on soybean<br />
biomass yield at Chibwe On·farm site. Means followed by the same<br />
letter are not significantly different.<br />
With PAPR·there was a response to P <strong>for</strong> soybean<br />
biomass <strong>and</strong> gra<strong>in</strong> yields only to residual application<br />
of the fertilizer. Highest biomass <strong>and</strong> gra<strong>in</strong><br />
yields were obta<strong>in</strong>ed at the lower rate of 13.5 <strong>and</strong> 27<br />
kg P20S ha- 1 <strong>for</strong> biomass <strong>and</strong> 27 kg PiOs ha- 1 <strong>for</strong> soybean<br />
gra<strong>in</strong> yield. Both the biomass <strong>and</strong> gra<strong>in</strong> yields<br />
decreased with <strong>in</strong>creased rate of P so that there was<br />
no response to P at the ·highest rate (120 kg P20S<br />
ha- 1 ) with <strong>and</strong> without lim<strong>in</strong>g <strong>for</strong> gra<strong>in</strong> yield <strong>and</strong><br />
without lim<strong>in</strong>g <strong>for</strong> biomass. The effect of lime <strong>for</strong><br />
MAP was similar, except at the lowest rate of P <strong>for</strong><br />
gra<strong>in</strong> <strong>and</strong> biomass yield. The reduction of soybean<br />
gra<strong>in</strong> yield with <strong>in</strong>creas<strong>in</strong>g rate of residual P application<br />
suggested adequacy of soil P <strong>for</strong> crop production.<br />
The residual effect of P <strong>for</strong> PAPR was thus<br />
more effective than that of the fresh <strong>and</strong> residual<br />
application of MAP because adequacy <strong>in</strong> soil P <strong>for</strong><br />
plant growth -:vas reached at a lower rate of P application.<br />
On Makeni soil series at GART, higher gra<strong>in</strong> yields<br />
of soybean were obta<strong>in</strong>ed <strong>in</strong> the first cropp<strong>in</strong>g season<br />
with the recommended level of P application of<br />
60 kg P20S ha- 1 <strong>for</strong> MAP than at the improved technology<br />
level of 120 kg P20S ha- 1 . This is shown <strong>in</strong><br />
Figure 5. The yields were 2.4 times more than the<br />
control treatment. In the case of P APR, the soybean<br />
yields were similar <strong>for</strong> both the recommended <strong>and</strong><br />
improved technology with a two-fold <strong>in</strong>crease <strong>in</strong><br />
soybean yield compared to the unfertilized control.<br />
There was a significant reduction (p


