

Grain Legumes and Green Manures for Soil Fertility in ... - cimmyt
Grain Legumes and Green Manures for Soil Fertility in ... - cimmyt
Grain Legumes and Green Manures for Soil Fertility in ... - cimmyt

Create successful ePaper yourself
Turn your PDF publications into a flip-book with our unique Google optimized e-Paper software.
above-ground biomass was not translated <strong>in</strong>to<br />
higher gra<strong>in</strong> yields, suggest<strong>in</strong>g poor photosynthate<br />
partition<strong>in</strong>g to pods. This was despite <strong>Soil</strong> P <strong>in</strong>creas<strong>in</strong>g<br />
with P application, reach<strong>in</strong>g ad~quate levels <strong>for</strong><br />
plant growth at greater than 60 kg P20S ha- l <strong>for</strong> both<br />
sources of P. The low shell<strong>in</strong>g percentage <strong>in</strong>dicated<br />
that there was need <strong>for</strong> lim<strong>in</strong>g. PAPR was 2.5 times<br />
more effective <strong>in</strong> <strong>in</strong>creas<strong>in</strong>g the level of soil P at the<br />
highest rate of P applied (120 kg P20s ha- 1 ). For<br />
MAP, soil P decreased at this high application rate.<br />
The higher rates of P applied as PAPR tended to <strong>in</strong>crease<br />
soil P values <strong>and</strong> <strong>in</strong> tum tended to produce<br />
higher gra<strong>in</strong> yields <strong>and</strong> <strong>in</strong>creased shell<strong>in</strong>g percentage.<br />
In the second cropp<strong>in</strong>g season, add<strong>in</strong>g nutrients<br />
other than P (N, K, S) <strong>in</strong>creased biomass yield over<br />
the absolute control, <strong>in</strong>dicat<strong>in</strong>g that these nutrients<br />
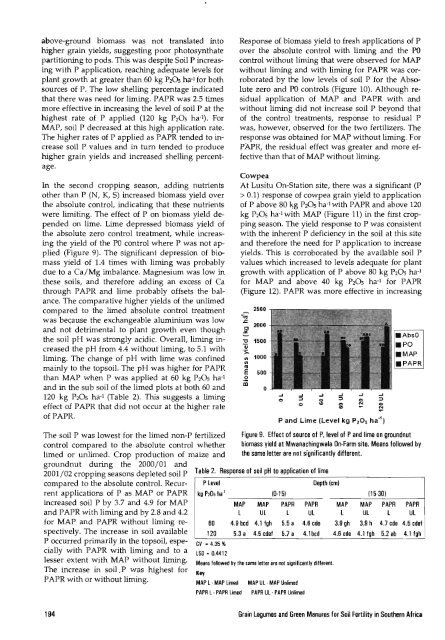
were limit<strong>in</strong>g. The effect of P on biomass yield depended<br />
on lime. Lime depressed biomass yield of<br />
the absolute zero control treatment, while <strong>in</strong>creas<strong>in</strong>g<br />
the yield of the PO control where P was not applied<br />
(Figure 9). The significant depression of biomass<br />
yield of 1.4 times with lim<strong>in</strong>g was probably<br />
due to a Ca/Mg imbalance. Magnesium was low <strong>in</strong><br />
these soils, <strong>and</strong> there<strong>for</strong>e add<strong>in</strong>g an excess of Ca<br />
through P APR <strong>and</strong> lime probably offsets the balance.<br />
The comparative higher yields of the unlimed<br />
compared to the limed absolute control treatment<br />
was because the exchangeable alum<strong>in</strong>ium was low<br />
<strong>and</strong> not detrimental to plant growth even though<br />
the soil pH was strongly acidic. Overall, lim<strong>in</strong>g <strong>in</strong>creased<br />
the pH from 4.4 without lim<strong>in</strong>g, to 5.1 wi'th<br />
lim<strong>in</strong>g. The change of pH with lime was conf<strong>in</strong>ed<br />
ma<strong>in</strong>ly to the topsoil. The pH was higher <strong>for</strong> PAPR<br />
than MAP when P was applied at 60 kg P20S ha- 1<br />
<strong>and</strong> <strong>in</strong> the sub soil of the limed plots at both 60 <strong>and</strong><br />
120 kg P20 S ha- 1 (Table 2). This suggests a lim<strong>in</strong>g<br />
effect of PAPR that did not occur at the higher rate<br />
of PAPR.<br />
Response of biomass yield to fresh applications of P<br />
over the absolute control with lim<strong>in</strong>g <strong>and</strong> the PO<br />
control without lim<strong>in</strong>g that were observed <strong>for</strong> MAP<br />
without lim<strong>in</strong>g <strong>and</strong> with lim<strong>in</strong>g <strong>for</strong> PAPR was corroborated<br />
by the low levels of soil P<strong>for</strong> the Absolute<br />
zero <strong>and</strong> PO controls (Figure 10). Although residual<br />
application of MAP <strong>and</strong> PAPR with <strong>and</strong><br />
without lim<strong>in</strong>g did not <strong>in</strong>crease soil P beyond that<br />
of the control treatments, response to residual P<br />
was, however, observed <strong>for</strong> the two fertilizers. The<br />
response was obta<strong>in</strong>ed <strong>for</strong> MAp without lim<strong>in</strong>g. For<br />
PAPR, the residual effect was greater <strong>and</strong> more effective<br />
than that of MAP without lim<strong>in</strong>g.<br />
Cowpea<br />
At Lusitu On-Station site, there was a significant (P<br />
> 0.1) response of cowpea gra<strong>in</strong> yield to application<br />
of P above 80 ~g P20S ha- 1 with P APR <strong>and</strong> above 120<br />
kg P20S ha- 1 with MAP (Figure 11) <strong>in</strong> the first cropp<strong>in</strong>g<br />
season. The yield response to P was consistent<br />
with the <strong>in</strong>herent P deficiency <strong>in</strong> the soil at this. site<br />
<strong>and</strong> there<strong>for</strong>e the need <strong>for</strong> P application to <strong>in</strong>crease<br />
yields. This is corroborated by the available soil P<br />
values which <strong>in</strong>creased to levels adequate <strong>for</strong> plant<br />
growth with application of P above 80 kg P20S ha- 1<br />
<strong>for</strong> MAP <strong>and</strong> above 40 kg P20S ha- 1 <strong>for</strong> P APR<br />
(Figure 12).PAPR was more effective <strong>in</strong> <strong>in</strong>creas<strong>in</strong>g<br />
2500 ,....,.,.,.....,..,...,<br />
'0 1500<br />
'ii<br />
'>,<br />
UI 1000<br />
UI<br />
IV<br />
E 500<br />
.2<br />
In<br />
0<br />
....I ....I ....I ....I ....I<br />
o<br />
;:)<br />
o o<br />
;:)<br />
o CD N<br />
.... o<br />
N<br />
....<br />
P <strong>and</strong> Lime (Level kg PzOs ha- 1 )<br />
The soil P was lowest <strong>for</strong> the limed non-P fertilized<br />
control compared to the absolute control whether<br />
limed or unlimed. Crop production of maize <strong>and</strong><br />
groundnut dur<strong>in</strong>g the 2000/01 <strong>and</strong><br />
Figure 9. Effect of source of P, level of P<strong>and</strong> lime on groundnut<br />
biomass yield at Mwanach<strong>in</strong>gwala On-Farm site. Means followed by<br />
the same letter are not significantly different.<br />
2001/02 cropp<strong>in</strong>g seasons depleted soil P Table 2. Response of soil pH to application of lime<br />
compared to the absolute control. Recur P level Depth (cm)<br />
rent applications of P as MAP or PAPR kg PzO~ hal (0-15)<br />
<strong>in</strong>creased soil P by 3.7 <strong>and</strong> 4.9 <strong>for</strong> MAP MAP MAP PAPR PAPR MAP<br />
<strong>and</strong> PAPR with lim<strong>in</strong>g <strong>and</strong> by 2.8 <strong>and</strong> 4.2 l Ul l Ul l<br />
<strong>for</strong> MAP <strong>and</strong> PAPR without lim<strong>in</strong>g re 60 4.9 bcd 4.1 fgh 5.5 a 4.6 cde 3.9 gh<br />
spectively. The <strong>in</strong>crease <strong>in</strong> soil available 120<br />
P occurred primarily <strong>in</strong> the topsoil, espe- CV _ 4.35 %<br />
5.3 a 4.5 cde! 5.7 a 4.1bcd 4.6 cde<br />
cially with PAPR with lim<strong>in</strong>g <strong>and</strong> to a LSD _ 0.4412<br />
lesser extent with MAP without lim<strong>in</strong>g. Means followed by the same letter are not significantly different.<br />
The <strong>in</strong>crease <strong>in</strong> soil.P was highest <strong>for</strong> Key<br />
PAPR with or without lim<strong>in</strong>g.<br />
MAP L . MAP Limed MAP UL· MAP Unlimed<br />
PAPR L . PAPR Limed<br />
PAPR UL . PAPR Unlimed<br />
(15·30)<br />
MAP PAPR PAPR<br />
Ul l Ul<br />
3.9 h 4.7 cde 4.5 cdef<br />
4.1 fgh 5.2 ab 4.1 fgh<br />
194<br />
<strong>Gra<strong>in</strong></strong> <strong>Legumes</strong> <strong>and</strong> <strong>Green</strong> <strong>Manures</strong> <strong>for</strong> <strong>Soil</strong> <strong>Fertility</strong> <strong>in</strong> Southern Africa


