

Grain Legumes and Green Manures for Soil Fertility in ... - cimmyt
Grain Legumes and Green Manures for Soil Fertility in ... - cimmyt
Grain Legumes and Green Manures for Soil Fertility in ... - cimmyt

Create successful ePaper yourself
Turn your PDF publications into a flip-book with our unique Google optimized e-Paper software.
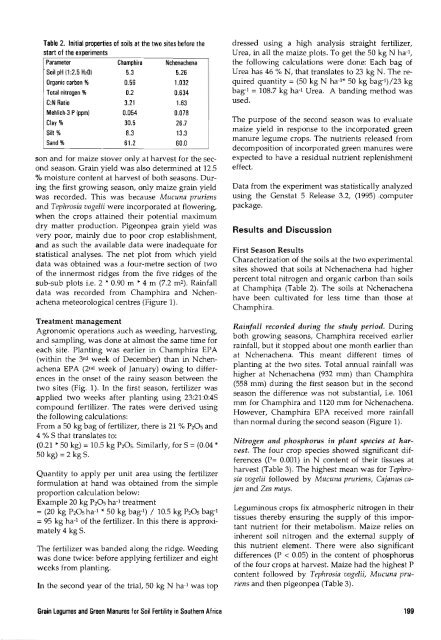
Table 2. Initial properties of soils at the two sites be<strong>for</strong>e the<br />
start of the experiments<br />
Parameter Champhira Nchenachena<br />
<strong>Soil</strong> pH (1 :2.5 H2O) 5.3 5.26<br />
Organic carbon % 0.56 1.032<br />
Total nitrogen % 0.2 0.634<br />
C:N Ratio 3.21 1.63 <br />
Mehlich·3 P(ppm) 0.054 0.078 <br />
Clay % 30.5 26.7 <br />
Silt % 8.3 13.3 <br />
S<strong>and</strong> % 61.2 60.0 <br />
son <strong>and</strong> <strong>for</strong> maize stover orily at harvest <strong>for</strong> the second<br />
season. <strong>Gra<strong>in</strong></strong> yield was also determ<strong>in</strong>ed at 12.5<br />
% moisture content at harvest of both seasons. Dur<strong>in</strong>g<br />
the first grow<strong>in</strong>g season, only maize gra<strong>in</strong> yield<br />
was recorded. This was because Mucuna pruriens<br />
<strong>and</strong> Tephrosia vogelii were <strong>in</strong>corporated at flower<strong>in</strong>g,<br />
when the crops atta<strong>in</strong>ed their potential maximum<br />
dry matter production. Pigeonpea gra<strong>in</strong> yield was<br />
very poor, ma<strong>in</strong>ly due to poor crop establishment,<br />
<strong>and</strong> as such the available data were <strong>in</strong>adequate <strong>for</strong><br />
statistical analyses. The net plot from which yield<br />
data was obta<strong>in</strong>ed was a four-metre section of two<br />
of the <strong>in</strong>nermost ridges from the five ridges of the<br />
sub-sub plots i.e. 2 * 0.90 m * 4 m (7.2 m2). Ra<strong>in</strong>fall<br />
data was recorded from Champhira <strong>and</strong> Nchenachena<br />
meteorological centres (Figure 1).<br />
Treatment management<br />
Agronomic operations 3uch as weed<strong>in</strong>g, harvest<strong>in</strong>g,<br />
<strong>and</strong> sampl<strong>in</strong>g, was done at almost the same time <strong>for</strong><br />
each ·site. Plant<strong>in</strong>g was earlier <strong>in</strong> Champhira EPA<br />
(with<strong>in</strong> the 3 rd week of December) than <strong>in</strong> Nchenachena<br />
EPA (2 nd week of January) ow<strong>in</strong>g to differences<br />
<strong>in</strong> the onset of the ra<strong>in</strong>y season between the<br />
two sites (Fig. 1). In the first season, fertilizer was<br />
applied two weeks after plant<strong>in</strong>g us<strong>in</strong>g 23:21 :0:4S<br />
compound fertilizer. The rates were derived us<strong>in</strong>g<br />
the follow<strong>in</strong>g calculations:<br />
From a 50 kg bag of fertilizer, there is 21 % P20S <strong>and</strong><br />
4 % S that translates to:<br />
(0.21 * 50 kg) = 10.5 kg P20S. Similarly, <strong>for</strong> S = (0.04 *<br />
50 kg) = 2 kg S.<br />
Quantity to apply per unit area us<strong>in</strong>g the fertilizer<br />
<strong>for</strong>mulation at h<strong>and</strong> was obta<strong>in</strong>ed from the simple<br />
proportion calculation below:<br />
Example 20 kg P20S ha·1 treahnent<br />
= (20 kg P20sha·1 * 50 kg bag-I) / 10.5 kg P20S bag- I<br />
= 95 kg ha·1 of the fertilizer. In this there is approximately<br />
4 kg S.<br />
The fertilizer was b<strong>and</strong>ed along the ridge. Weed<strong>in</strong>g<br />
was done twice: be<strong>for</strong>e apply<strong>in</strong>g fertilizer <strong>and</strong> eight<br />
weeks from plant<strong>in</strong>g.<br />
In the second year of the trial, 50 kg N ha·1 was top<br />
dressed us<strong>in</strong>g a high analysis straight fertilizer,<br />
Urea, <strong>in</strong> all the maize.plots. To get the 50 kg N ha·I,<br />
the follow<strong>in</strong>g calculations were done: Each bag of<br />
Urea has 46 % N,that translates to 23 kg N. The required<br />
quantity =(50 kg N ha- 1 * 50 kg bag- 1 )/23 kg<br />
bag- I = 108.7 kg ha·1 Urea. A b<strong>and</strong><strong>in</strong>g method was<br />
used.<br />
The purpose of the second season was to evaluate<br />
maize yield <strong>in</strong> response to the <strong>in</strong>corporated green<br />
manure legume crops. The nutrients released from<br />
decomposition of <strong>in</strong>corporated green manures were<br />
expected to have a residual nutrient replenishment<br />
effect.<br />
Data from the experiment was statistically analyzed<br />
us<strong>in</strong>g the Genstat 5 Release -3.2, (1995) computer<br />
package.<br />
Results <strong>and</strong> Discussion<br />
First Season Results<br />
Characterization of the soils at the two experimental<br />
sites showed that soils at Nchenachena had higher<br />
percent total nitrogen <strong>and</strong> organic carbon than soils<br />
at ChamphiJ;"a (Table 2). The soils at Nchenachena<br />
have been cultivated <strong>for</strong> less time than those at<br />
Champhira.<br />
Ra<strong>in</strong>fall recorded dur<strong>in</strong>g the study period. Dur<strong>in</strong>g<br />
both grow<strong>in</strong>g seasons, Champhira received earlier<br />
ra<strong>in</strong>fall, but it stopped about one month earlier than<br />
at Nchenachena. This meant different times of<br />
plant<strong>in</strong>g at the two sites. Total annual ra<strong>in</strong>fall was<br />
higher at Nchenachena (932 mm) than Champhira<br />
(558 mm) dur<strong>in</strong>g the first season but <strong>in</strong> the second<br />
season the difference was not substantial, i.e. 1061<br />
mm <strong>for</strong> Champhira <strong>and</strong> 1120 mm <strong>for</strong> Nchenachena.<br />
However, Champhira EPA received more ra<strong>in</strong>fall<br />
than normal dur<strong>in</strong>g the second season (Figure 1).<br />
Nitrogen <strong>and</strong> phosphorus <strong>in</strong> plant species at harvest.<br />
The four crop species showed significant differences<br />
(P= 0.001) <strong>in</strong> N content of their tissues at<br />
harvest (Table 3). The highest mean was <strong>for</strong> TephrDsia<br />
vogelii followed by Mucuna pruriens, Cajanus cajan<br />
<strong>and</strong> Zea mays.<br />
Legum<strong>in</strong>ous crops fix ahnospheric nitrogen <strong>in</strong> their<br />
tissues thereby ensur<strong>in</strong>g the supply of this important<br />
nutrient <strong>for</strong> their metabolism. Maize relies on<br />
<strong>in</strong>herent soil nitrogen <strong>and</strong> the external supply of<br />
this nutrient element. There were also Significant<br />
differences (P < 0.05) <strong>in</strong> the content of phosphorus<br />
of the four crops at harvest. Maize had the highest P<br />
content followed by Tephrosia vogelii, Mucuna pruriens<br />
<strong>and</strong> then pigeonpea (Table 3).<br />
<strong>Gra<strong>in</strong></strong> legumes <strong>and</strong> <strong>Green</strong> <strong>Manures</strong> <strong>for</strong> <strong>Soil</strong> <strong>Fertility</strong> <strong>in</strong> Southern Africa<br />
199


