Registration Document BOUYGUES
Registration Document BOUYGUES
Registration Document BOUYGUES

Create successful ePaper yourself
Turn your PDF publications into a flip-book with our unique Google optimized e-Paper software.
2011 key figures<br />
The Bouygues group had a good year<br />
in 2011, with solid operating performances<br />
and excellent sales for the Construction<br />
businesses. The Group is also in a robust<br />
financial position.<br />
financial hiGhliGhtS<br />
(€ million) 2010 2011 2011/2010<br />
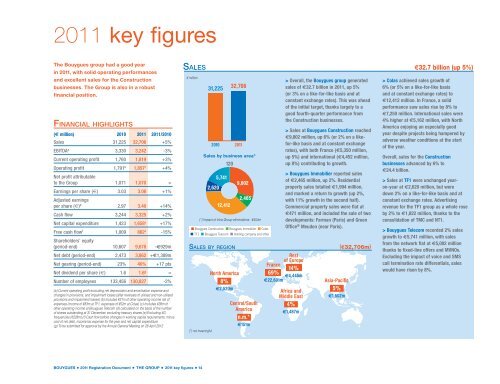
Sales 31,225 32,706 +5%<br />
EBITDA a 3,330 3,242 -3%<br />
Current operating profit 1,760 1,819 +3%<br />
Operating profit 1,791 b 1,857 c +4%<br />
Net profit attributable<br />
to the Group 1,071 1,070 =<br />
Earnings per share (€) 3.03 3.06 +1%<br />
Adjusted earnings<br />
per share (€) d 2.97 3.40 +14%<br />
Cash flow 3,244 3,325 +2%<br />
Net capital expenditure 1,423 1,658 e +17%<br />
Free cash flow f 1,009 862 e -15%<br />
Shareholders’ equity<br />
(period-end) 10,607 9,678 -€929m<br />
Net debt (period-end) 2,473 3,862 +€1,389m<br />
Net gearing (period-end) 23% 40% +17 pts<br />
Net dividend per share (€) 1.6 1.6 g =<br />
Number of employees 133,456 130,827 -2%<br />
(a) Current operating profit excluding net depreciation and amortisation expense and<br />
changes in provisions, and impairment losses (after reversals of utilised and non-utilised<br />
provisions and impairment losses) (b) Includes €31m of other operating income net of<br />
expenses (income of €83m at TF1, expenses of €52m at Colas) (c) Includes €38m of<br />
other operating income at Bouygues Telecom (d) calculated on the basis of the number<br />
of shares outstanding at 31 December, excluding treasury shares (e) Excluding 4G<br />
frequencies (€228m) (f) Cash flow before changes in working capital requirements, minus<br />
cost of net debt, income tax expense for the year and net capital expenditure<br />
(g) To be submitted for approval by the Annual General Meeting on 26 April 2012<br />
SaleS e32.7 billion (up 5%)<br />
€ million<br />
(*) not meaningful<br />
31,225<br />
2010<br />
32,706<br />
2011<br />
Sales by business area*<br />
120<br />
2,620<br />
5,741<br />
12,412<br />
North America<br />
8%<br />
e2,520m<br />
9,802<br />
2,465<br />
(*) Impact of intra-Group eliminations: -€454m<br />
n Bouygues Construction n Bouygues Immobilier n Colas<br />
n TF1 n Bouygues Telecom n Holding company and other<br />
SaleS by reGion<br />
Central/South<br />
America<br />
n.m.*<br />
e151m<br />
Rest<br />
of Europe<br />
France<br />
14%<br />
69%<br />
e4,445m<br />
e22,601m<br />
> Overall, the Bouygues group generated<br />
sales of €32.7 billion in 2011, up 5%<br />
(or 3% on a like-for-like basis and at<br />
constant exchange rates). This was ahead<br />
of the initial target, thanks largely to a<br />
good fourth-quarter performance from<br />
the Construction businesses.<br />
> Sales at Bouygues Construction reached<br />
€9,802 million, up 6% (or 2% on a likefor-like<br />
basis and at constant exchange<br />
rates), with both France (€5,350 million,<br />
up 5%) and international (€4,452 million,<br />
up 8%) contributing to growth.<br />
> Bouygues Immobilier reported sales<br />
of €2,465 million, up 2%. Residential<br />
property sales totalled €1,994 million,<br />
and marked a return to growth (up 2%,<br />
with 11% growth in the second half).<br />
Commercial property sales were flat at<br />
€471 million, and included the sale of two<br />
developments: Farman (Paris) and Green<br />
Office ® Meudon (near Paris).<br />
Africa and<br />
Middle East<br />
4%<br />
e1,487m<br />
Asia-Pacific<br />
5%<br />
e1,502m<br />
(e32,706m)<br />
> Colas achieved sales growth of<br />
6% (or 5% on a like-for-like basis<br />
and at constant exchange rates) to<br />
€12,412 million. In France, a solid<br />
performance saw sales rise by 8% to<br />
€7,250 million. International sales were<br />
4% higher at €5,162 million, with North<br />
America enjoying an especially good<br />
year despite projects being hampered by<br />
adverse weather conditions at the start<br />
of the year.<br />
Overall, sales for the Construction<br />
businesses advanced by 6% to<br />
€24.4 billion.<br />
> Sales at TF1 were unchanged yearon-year<br />
at €2,620 million, but were<br />
down 2% on a like-for-like basis and at<br />
constant exchange rates. Advertising<br />
revenue for the TF1 group as a whole rose<br />
by 2% to €1,822 million, thanks to the<br />
consolidation of TMC and NT1.<br />
> Bouygues Telecom recorded 2% sales<br />
growth to €5,741 million, with sales<br />
from the network flat at €5,082 million<br />
thanks to fixed-line offers and MVNOs.<br />
Excluding the impact of voice and SMS<br />
call termination rate differentials, sales<br />
would have risen by 8%.<br />
<strong>BOUYGUES</strong> • 2011 <strong>Registration</strong> <strong>Document</strong> • THE GROUP • 2011 key figures • 14