Registration Document BOUYGUES
Registration Document BOUYGUES
Registration Document BOUYGUES

You also want an ePaper? Increase the reach of your titles
YUMPU automatically turns print PDFs into web optimized ePapers that Google loves.
Stock market information<br />
4<br />
Legal and financial<br />
information<br />
Stock market information<br />
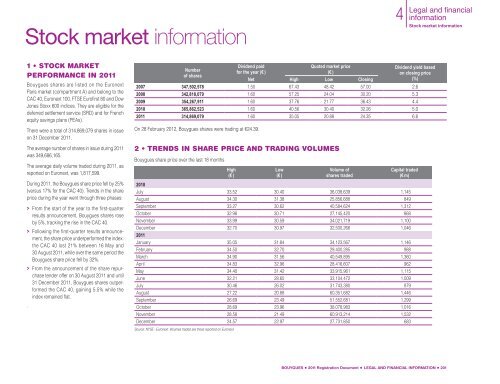
1 • STOCK MARKET<br />
PERFORMANCE IN 2011<br />
Bouygues shares are listed on the Euronext<br />
Paris market (compartment A) and belong to the<br />
CAC 40, Euronext 100, FTSE Eurofirst 80 and Dow<br />
Jones Stoxx 600 indices. They are eligible for the<br />
deferred settlement service (SRD) and for French<br />
equity savings plans (PEAs).<br />
There were a total of 314,869,079 shares in issue<br />
on 31 December 2011.<br />
The average number of shares in issue during 2011<br />
was 349,686,165.<br />
The average daily volume traded during 2011, as<br />
reported on Euronext, was 1,817,599.<br />
During 2011, the Bouygues share price fell by 25%<br />
(versus 17% for the CAC 40). Trends in the share<br />
price during the year went through three phases:<br />
> From the start of the year to the first-quarter<br />
results announcement, Bouygues shares rose<br />
by 5%, tracking the rise in the CAC 40.<br />
> Following the first-quarter results announcement,<br />
the share price underperformed the index:<br />
the CAC 40 lost 21% between 16 May and<br />
30 August 2011, while over the same period the<br />
Bouygues share price fell by 32%.<br />
> From the announcement of the share repurchase<br />
tender offer on 30 August 2011 and until<br />
31 December 2011, Bouygues shares outperformed<br />
the CAC 40, gaining 5.5% while the<br />
index remained flat.<br />
.<br />
Number<br />
of shares<br />
Dividend paid<br />
for the year (€)<br />
Quoted market price<br />
(€)<br />
Dividend yield based<br />
on closing price<br />
(%)<br />
Net High Low Closing<br />
2007 347,502,578 1.50 67.43 48.42 57.00 2.6<br />
2008 342,818,079 1.60 57.25 24.04 30.20 5.3<br />
2009 354,267,911 1.60 37.76 21.77 36.43 4.4<br />
2010 365,862,523 1.60 40.56 30.40 32.26 5.0<br />
2011 314,869,079 1.60 35.05 20.88 24.35 6.6<br />
On 28 February 2012, Bouygues shares were trading at €24.39.<br />
2 • TRENDS IN SHARE PRICE AND TRADING VOLUMES<br />
Bouygues share price over the last 18 months<br />
High<br />
(€)<br />
Low<br />
(€)<br />
Volume of<br />
shares traded<br />
Capital traded<br />
(€m)<br />
2010<br />
July 33.52 30.40 36,038,639 1,145<br />
August 34.30 31.38 25,856,688 849<br />
September 33.27 30.62 40,584,624 1,312<br />
October 32.98 30.71 27,145,420 868<br />
November 33.99 30.59 34,021,719 1,100<br />
December 32.70 30.97 32,500,266 1,046<br />
2011<br />
January 35.05 31.84 34,123,567 1,146<br />
February 34.50 32.70 29,400,285 988<br />
March 34.90 31.56 40,549,895 1,360<br />
April 34.83 32.96 28,416,607 962<br />
May 34.40 31.42 33,915,961 1,115<br />
June 32.21 28.65 33,104,472 1,009<br />
July 30.46 26.02 31,743,380 879<br />
August 27.22 20.88 60,351,682 1,446<br />
September 26.69 23.49 51,552,681 1,299<br />
October 28.69 23.96 38,078,983 1,016<br />
November 28.58 21.49 60,913,214 1,532<br />
December 24.57 22.97 27,731,850 683<br />
Source: NYSE - Euronext. Volumes traded are those reported on Euronext<br />
<strong>BOUYGUES</strong> • 2011 <strong>Registration</strong> <strong>Document</strong> • LEGAL AND FINANCIAL INFORMATION • 201