Registration Document BOUYGUES
Registration Document BOUYGUES
Registration Document BOUYGUES

Create successful ePaper yourself
Turn your PDF publications into a flip-book with our unique Google optimized e-Paper software.
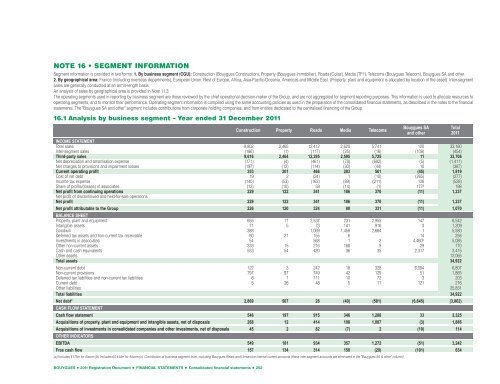
NOTE 16 • SEGMENT INFORMATION<br />
Segment information is provided in two forms: 1. By business segment (CGU): Construction (Bouygues Construction), Property (Bouygues Immobilier), Roads (Colas), Media (TF1), Telecoms (Bouygues Telecom), Bouygues SA and other.<br />
2. By geographical area: France (including overseas departments), European Union, Rest of Europe, Africa, Asia-Pacific-Oceania, Americas and Middle East. (Property, plant and equipment is allocated by location of the asset). Inter-segment<br />
sales are generally conducted at an arm’s-length basis.<br />
An analysis of sales by geographical area is provided in Note 11.3.<br />
The operating segments used in reporting by business segment are those reviewed by the chief operational decision-maker of the Group, and are not aggregated for segment reporting purposes. This information is used to allocate resources to<br />
operating segments, and to monitor their performance. Operating segment information is compiled using the same accounting policies as used in the preparation of the consolidated financial statements, as described in the notes to the financial<br />
statements. The "Bouygues SA and other" segment includes contributions from corporate holding companies, and from entities dedicated to the centralised financing of the Group.<br />
16.1 Analysis by business segment – Year ended 31 December 2011<br />
<strong>BOUYGUES</strong> • 2011 <strong>Registration</strong> <strong>Document</strong> • FINANCIAL STATEMENTS • Consolidated financial statements • 252<br />
Construction Property Roads Media Telecoms<br />
Bouygues SA<br />
and other<br />
INCOME STATEMENT<br />
Total sales 9,802 2,465 12,412 2,620 5,741 120 33,160<br />
Inter-segment sales (186) (1) (117) (25) (16) (109) (454)<br />
Third-party sales 9,616 2,464 12,295 2,595 5,725 11 32,706<br />
Net depreciation and amortisation expense (171) (4) (461) (78) (692) (5) (1,411)<br />
Net charges to provisions and impairment losses (197) (12) (114) (30) (44) 10 (387)<br />
Current operating profit 353 201 466 283 561 (45) 1,819<br />
Cost of net debt 19 2 (24) 1 (10) (265) (277)<br />
Income tax expense (140) (53) (163) (89) (211) 128 (528)<br />
Share of profits/(losses) of associates (13) (10) 59 (14) (1) 177 a 198<br />
Net profit from continuing operations 229 122 341 186 370 (11) 1,237<br />
Net profit of discontinued and held-for-sale operations<br />
Net profit 229 122 341 186 370 (11) 1,237<br />
Net profit attributable to the Group 226 120 324 80 331 (11) 1,070<br />
BALANCE SHEET<br />
Property, plant and equipment 655 17 2,537 231 2,955 147 6,542<br />
Intangible assets 71 5 73 141 916 3 1,209<br />
Goodwill 388 1,069 1,458 2,664 1 5,580<br />
Deferred tax assets and non-current tax receivable 60 21 155 6 14 256<br />
Investments in associates 54 568 1 2 4,460 b 5,085<br />
Other non-current assets 333 15 216 168 9 29 770<br />
Cash and cash equivalents 553 54 420 36 35 2,317 3,415<br />
Other assets 12,065<br />
Total assets 34,922<br />
Non-current debt 122 3 242 18 328 6,094 6,807<br />
Non-current provisions 797 97 749 42 129 51 1,865<br />
Deferred tax liabilities and non-current tax liabilities 6 1 111 10 72 3 203<br />
Current debt 5 26 48 5 11 121 216<br />
Other liabilities 25,831<br />
Total liabilities 34,922<br />
Net debt c 2,869 507 28 (40) (581) (6,645) (3,862)<br />
CASH FLOW STATEMENT<br />
Cash flow statement 546 197 915 346 1,288 33 3,325<br />
Acquisitions of property, plant and equipment and intangible assets, net of disposals 268 12 414 108 1,087 (3) 1,886<br />
Acquisitions of investments in consolidated companies and other investments, net of disposals 45 2 82 (7) 2 (10) 114<br />
OTHER INDICATORS<br />
EBITDA 549 181 934 357 1,272 (51) 3,242<br />
Free cash flow 157 134 314 150 (20) (101) 634<br />
(a) Includes €175m for Alstom (b) Includes €4,444m for Alstom (c) Contribution at business segment level, including Bouygues Relais and Uniservice internal current accounts (these inter-segment accounts are eliminated in the "Bouygues SA & other" column)<br />
Total<br />
2011