

ClimateChange Assessment Guide.pdf - University of Waterloo
ClimateChange Assessment Guide.pdf - University of Waterloo
ClimateChange Assessment Guide.pdf - University of Waterloo

Create successful ePaper yourself
Turn your PDF publications into a flip-book with our unique Google optimized e-Paper software.
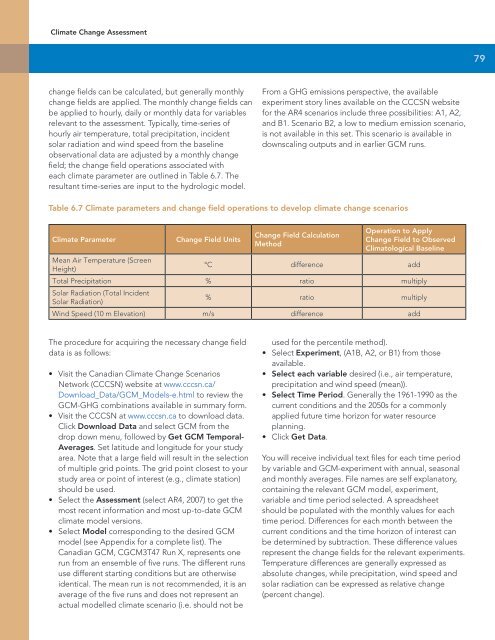
Climate Change <strong>Assessment</strong>79change fields can be calculated, but generally monthlychange fields are applied. The monthly change fields canbe applied to hourly, daily or monthly data for variablesrelevant to the assessment. Typically, time-series <strong>of</strong>hourly air temperature, total precipitation, incidentsolar radiation and wind speed from the baselineobservational data are adjusted by a monthly changefield; the change field operations associated witheach climate parameter are outlined in Table 6.7. Theresultant time-series are input to the hydrologic model.From a GHG emissions perspective, the availableexperiment story lines available on the CCCSN websitefor the AR4 scenarios include three possibilities: A1, A2,and B1. Scenario B2, a low to medium emission scenario,is not available in this set. This scenario is available indownscaling outputs and in earlier GCM runs.Table 6.7 Climate parameters and change field operations to develop climate change scenariosClimate ParameterChange Field UnitsChange Field CalculationMethodOperation to ApplyChange Field to ObservedClimatological BaselineMean Air Temperature (ScreenHeight)ºC difference addTotal Precipitation % ratio multiplySolar Radiation (Total IncidentSolar Radiation)% ratio multiplyWind Speed (10 m Elevation) m/s difference addThe procedure for acquiring the necessary change fielddata is as follows:• Visit the Canadian Climate Change ScenariosNetwork (CCCSN) website at www.cccsn.ca/Download_Data/GCM_Models-e.html to review theGCM-GHG combinations available in summary form.• Visit the CCCSN at www.cccsn.ca to download data.Click Download Data and select GCM from thedrop down menu, followed by Get GCM Temporal-Averages. Set latitude and longitude for your studyarea. Note that a large field will result in the selection<strong>of</strong> multiple grid points. The grid point closest to yourstudy area or point <strong>of</strong> interest (e.g., climate station)should be used.• Select the <strong>Assessment</strong> (select AR4, 2007) to get themost recent information and most up-to-date GCMclimate model versions.• Select Model corresponding to the desired GCMmodel (see Appendix for a complete list). TheCanadian GCM, CGCM3T47 Run X, represents onerun from an ensemble <strong>of</strong> five runs. The different runsuse different starting conditions but are otherwiseidentical. The mean run is not recommended, it is anaverage <strong>of</strong> the five runs and does not represent anactual modelled climate scenario (i.e. should not beused for the percentile method).• Select Experiment, (A1B, A2, or B1) from thoseavailable.• Select each variable desired (i.e., air temperature,precipitation and wind speed (mean)).• Select Time Period. Generally the 1961-1990 as thecurrent conditions and the 2050s for a commonlyapplied future time horizon for water resourceplanning.• Click Get Data.You will receive individual text files for each time periodby variable and GCM-experiment with annual, seasonaland monthly averages. File names are self explanatory,containing the relevant GCM model, experiment,variable and time period selected. A spreadsheetshould be populated with the monthly values for eachtime period. Differences for each month between thecurrent conditions and the time horizon <strong>of</strong> interest canbe determined by subtraction. These difference valuesrepresent the change fields for the relevant experiments.Temperature differences are generally expressed asabsolute changes, while precipitation, wind speed andsolar radiation can be expressed as relative change(percent change).


