

ClimateChange Assessment Guide.pdf - University of Waterloo
ClimateChange Assessment Guide.pdf - University of Waterloo
ClimateChange Assessment Guide.pdf - University of Waterloo

You also want an ePaper? Increase the reach of your titles
YUMPU automatically turns print PDFs into web optimized ePapers that Google loves.
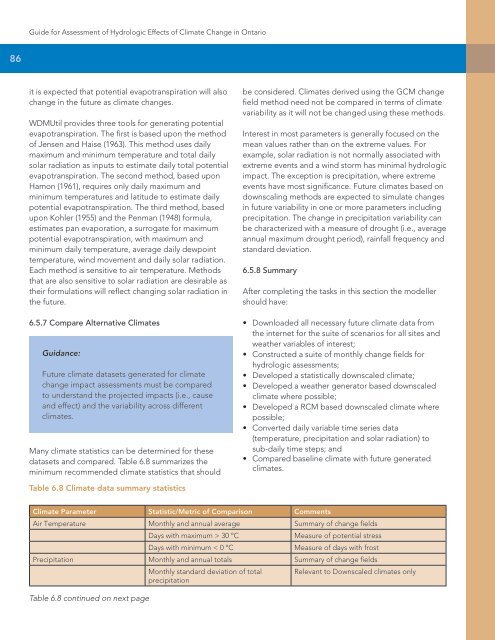
<strong>Guide</strong> for <strong>Assessment</strong> <strong>of</strong> Hydrologic Effects <strong>of</strong> Climate Change in Ontario86it is expected that potential evapotranspiration will alsochange in the future as climate changes.WDMUtil provides three tools for generating potentialevapotranspiration. The first is based upon the method<strong>of</strong> Jensen and Haise (1963). This method uses dailymaximum and minimum temperature and total dailysolar radiation as inputs to estimate daily total potentialevapotranspiration. The second method, based uponHamon (1961), requires only daily maximum andminimum temperatures and latitude to estimate dailypotential evapotranspiration. The third method, basedupon Kohler (1955) and the Penman (1948) formula,estimates pan evaporation, a surrogate for maximumpotential evapotranspiration, with maximum andminimum daily temperature, average daily dewpointtemperature, wind movement and daily solar radiation.Each method is sensitive to air temperature. Methodsthat are also sensitive to solar radiation are desirable astheir formulations will reflect changing solar radiation inthe future.6.5.7 Compare Alternative ClimatesGuidance:Future climate datasets generated for climatechange impact assessments must be comparedto understand the projected impacts (i.e., causeand effect) and the variability across differentclimates.Many climate statistics can be determined for thesedatasets and compared. Table 6.8 summarizes theminimum recommended climate statistics that shouldbe considered. Climates derived using the GCM changefield method need not be compared in terms <strong>of</strong> climatevariability as it will not be changed using these methods.Interest in most parameters is generally focused on themean values rather than on the extreme values. Forexample, solar radiation is not normally associated withextreme events and a wind storm has minimal hydrologicimpact. The exception is precipitation, where extremeevents have most significance. Future climates based ondownscaling methods are expected to simulate changesin future variability in one or more parameters includingprecipitation. The change in precipitation variability canbe characterized with a measure <strong>of</strong> drought (i.e., averageannual maximum drought period), rainfall frequency andstandard deviation.6.5.8 SummaryAfter completing the tasks in this section the modellershould have:• Downloaded all necessary future climate data fromthe internet for the suite <strong>of</strong> scenarios for all sites andweather variables <strong>of</strong> interest;• Constructed a suite <strong>of</strong> monthly change fields forhydrologic assessments;• Developed a statistically downscaled climate;• Developed a weather generator based downscaledclimate where possible;• Developed a RCM based downscaled climate wherepossible;• Converted daily variable time series data(temperature, precipitation and solar radiation) tosub-daily time steps; and• Compared baseline climate with future generatedclimates.Table 6.8 Climate data summary statisticsClimate Parameter Statistic/Metric <strong>of</strong> Comparison CommentsAir Temperature Monthly and annual average Summary <strong>of</strong> change fieldsDays with maximum > 30 ºCDays with minimum < 0 ºCMeasure <strong>of</strong> potential stressMeasure <strong>of</strong> days with frostPrecipitation Monthly and annual totals Summary <strong>of</strong> change fieldsMonthly standard deviation <strong>of</strong> total Relevant to Downscaled climates onlyprecipitationTable 6.8 continued on next page


