

ClimateChange Assessment Guide.pdf - University of Waterloo
ClimateChange Assessment Guide.pdf - University of Waterloo
ClimateChange Assessment Guide.pdf - University of Waterloo

You also want an ePaper? Increase the reach of your titles
YUMPU automatically turns print PDFs into web optimized ePapers that Google loves.
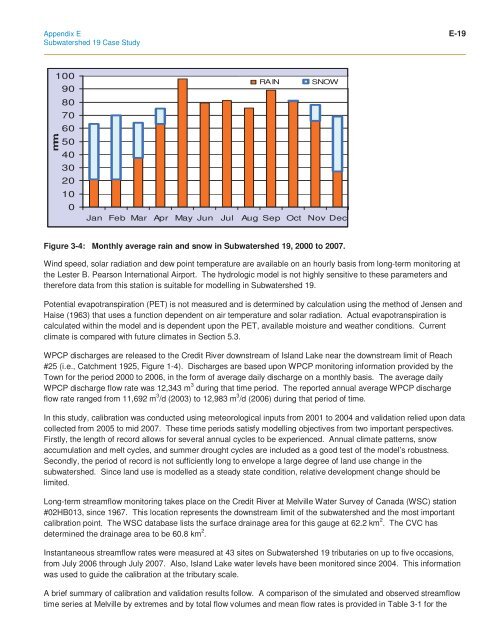
Appendix E E-19Subwatershed 19 Case Studymm.1009080706050403020100RAINSNOWJan Feb Mar Apr May Jun Jul Aug Sep Oct Nov DecFigure 3-4: Monthly average rain and snow in Subwatershed 19, 2000 to 2007.Wind speed, solar radiation and dew point temperature are available on an hourly basis from long-term monitoring atthe Lester B. Pearson International Airport. The hydrologic model is not highly sensitive to these parameters andtherefore data from this station is suitable for modelling in Subwatershed 19.Potential evapotranspiration (PET) is not measured and is determined by calculation using the method <strong>of</strong> Jensen andHaise (1963) that uses a function dependent on air temperature and solar radiation. Actual evapotranspiration iscalculated within the model and is dependent upon the PET, available moisture and weather conditions. Currentclimate is compared with future climates in Section 5.3.WPCP discharges are released to the Credit River downstream <strong>of</strong> Island Lake near the downstream limit <strong>of</strong> Reach#25 (i.e., Catchment 1925, Figure 1-4). Discharges are based upon WPCP monitoring information provided by theTown for the period 2000 to 2006, in the form <strong>of</strong> average daily discharge on a monthly basis. The average dailyWPCP discharge flow rate was 12,343 m 3 during that time period. The reported annual average WPCP dischargeflow rate ranged from 11,692 m 3 /d (2003) to 12,983 m 3 /d (2006) during that period <strong>of</strong> time.In this study, calibration was conducted using meteorological inputs from 2001 to 2004 and validation relied upon datacollected from 2005 to mid 2007. These time periods satisfy modelling objectives from two important perspectives.Firstly, the length <strong>of</strong> record allows for several annual cycles to be experienced. Annual climate patterns, snowaccumulation and melt cycles, and summer drought cycles are included as a good test <strong>of</strong> the model’s robustness.Secondly, the period <strong>of</strong> record is not sufficiently long to envelope a large degree <strong>of</strong> land use change in thesubwatershed. Since land use is modelled as a steady state condition, relative development change should belimited.Long-term streamflow monitoring takes place on the Credit River at Melville Water Survey <strong>of</strong> Canada (WSC) station#02HB013, since 1967. This location represents the downstream limit <strong>of</strong> the subwatershed and the most importantcalibration point. The WSC database lists the surface drainage area for this gauge at 62.2 km 2 . The CVC hasdetermined the drainage area to be 60.8 km 2 .Instantaneous streamflow rates were measured at 43 sites on Subwatershed 19 tributaries on up to five occasions,from July 2006 through July 2007. Also, Island Lake water levels have been monitored since 2004. This informationwas used to guide the calibration at the tributary scale.A brief summary <strong>of</strong> calibration and validation results follow. A comparison <strong>of</strong> the simulated and observed streamflowtime series at Melville by extremes and by total flow volumes and mean flow rates is provided in Table 3-1 for the


