ClimateChange Assessment Guide.pdf - University of Waterloo
ClimateChange Assessment Guide.pdf - University of Waterloo
ClimateChange Assessment Guide.pdf - University of Waterloo
Create successful ePaper yourself
Turn your PDF publications into a flip-book with our unique Google optimized e-Paper software.
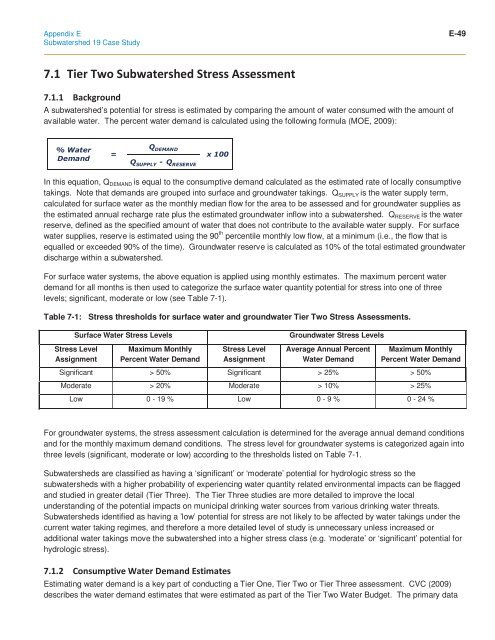
Appendix E E-49Subwatershed 19 Case Study A subwatershed’s potential for stress is estimated by comparing the amount <strong>of</strong> water consumed with the amount <strong>of</strong>available water. The percent water demand is calculated using the following formula (MOE, 2009): In this equation, Q DEMAND is equal to the consumptive demand calculated as the estimated rate <strong>of</strong> locally consumptivetakings. Note that demands are grouped into surface and groundwater takings. Q SUPPLY is the water supply term,calculated for surface water as the monthly median flow for the area to be assessed and for groundwater supplies asthe estimated annual recharge rate plus the estimated groundwater inflow into a subwatershed. Q RESERVE is the waterreserve, defined as the specified amount <strong>of</strong> water that does not contribute to the available water supply. For surfacewater supplies, reserve is estimated using the 90 th percentile monthly low flow, at a minimum (i.e., the flow that isequalled or exceeded 90% <strong>of</strong> the time). Groundwater reserve is calculated as 10% <strong>of</strong> the total estimated groundwaterdischarge within a subwatershed.For surface water systems, the above equation is applied using monthly estimates. The maximum percent waterdemand for all months is then used to categorize the surface water quantity potential for stress into one <strong>of</strong> threelevels; significant, moderate or low (see Table 7-1).Table 7-1: Stress thresholds for surface water and groundwater Tier Two Stress <strong>Assessment</strong>s.Surface Water Stress LevelsGroundwater Stress LevelsStress LevelAssignmentMaximum MonthlyPercent Water DemandStress LevelAssignmentAverage Annual PercentWater DemandMaximum MonthlyPercent Water DemandSignificant > 50% Significant > 25% > 50%Moderate > 20% Moderate > 10% > 25%Low 0 - 19 % Low 0 - 9 % 0 - 24 %For groundwater systems, the stress assessment calculation is determined for the average annual demand conditionsand for the monthly maximum demand conditions. The stress level for groundwater systems is categorized again intothree levels (significant, moderate or low) according to the thresholds listed on Table 7-1.Subwatersheds are classified as having a ‘significant’ or ‘moderate’ potential for hydrologic stress so thesubwatersheds with a higher probability <strong>of</strong> experiencing water quantity related environmental impacts can be flaggedand studied in greater detail (Tier Three). The Tier Three studies are more detailed to improve the localunderstanding <strong>of</strong> the potential impacts on municipal drinking water sources from various drinking water threats.Subwatersheds identified as having a ’low’ potential for stress are not likely to be affected by water takings under thecurrent water taking regimes, and therefore a more detailed level <strong>of</strong> study is unnecessary unless increased oradditional water takings move the subwatershed into a higher stress class (e.g. ‘moderate’ or ‘significant’ potential forhydrologic stress). Estimating water demand is a key part <strong>of</strong> conducting a Tier One, Tier Two or Tier Three assessment. CVC (2009)describes the water demand estimates that were estimated as part <strong>of</strong> the Tier Two Water Budget. The primary data


