

ClimateChange Assessment Guide.pdf - University of Waterloo
ClimateChange Assessment Guide.pdf - University of Waterloo
ClimateChange Assessment Guide.pdf - University of Waterloo

You also want an ePaper? Increase the reach of your titles
YUMPU automatically turns print PDFs into web optimized ePapers that Google loves.
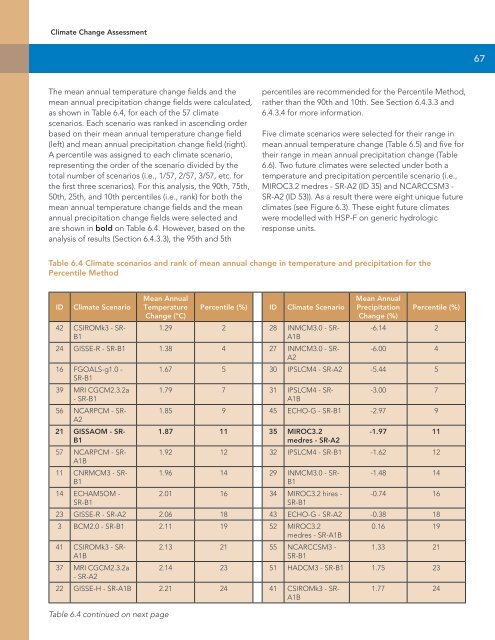
Climate Change <strong>Assessment</strong>67The mean annual temperature change fields and themean annual precipitation change fields were calculated,as shown in Table 6.4, for each <strong>of</strong> the 57 climatescenarios. Each scenario was ranked in ascending orderbased on their mean annual temperature change field(left) and mean annual precipitation change field (right).A percentile was assigned to each climate scenario,representing the order <strong>of</strong> the scenario divided by thetotal number <strong>of</strong> scenarios (i.e., 1/57, 2/57, 3/57, etc. forthe first three scenarios). For this analysis, the 90th, 75th,50th, 25th, and 10th percentiles (i.e., rank) for both themean annual temperature change fields and the meanannual precipitation change fields were selected andare shown in bold on Table 6.4. However, based on theanalysis <strong>of</strong> results (Section 6.4.3.3), the 95th and 5thpercentiles are recommended for the Percentile Method,rather than the 90th and 10th. See Section 6.4.3.3 and6.4.3.4 for more information.Five climate scenarios were selected for their range inmean annual temperature change (Table 6.5) and five fortheir range in mean annual precipitation change (Table6.6). Two future climates were selected under both atemperature and precipitation percentile scenario (i.e.,MIROC3.2 medres - SR-A2 (ID 35) and NCARCCSM3 -SR-A2 (ID 53)). As a result there were eight unique futureclimates (see Figure 6.3). These eight future climateswere modelled with HSP-F on generic hydrologicresponse units.Table 6.4 Climate scenarios and rank <strong>of</strong> mean annual change in temperature and precipitation for thePercentile MethodIDClimate Scenario42 CSIROMk3 - SR-B1Mean AnnualTemperatureChange (ºC)Percentile (%) ID Climate Scenario1.29 2 28 INMCM3.0 - SR-A1BMean AnnualPrecipitation Percentile (%)Change (%)-6.14 224 GISSE-R - SR-B1 1.38 4 27 INMCM3.0 - SR- -6.00 4A216 FGOALS-g1.0 -SR-B11.67 5 30 IPSLCM4 - SR-A2 -5.44 539 MRI CGCM2.3.2a- SR-B156 NCARPCM - SR-A221 GISSAOM - SR-B157 NCARPCM - SR-A1B11 CNRMCM3 - SR-B114 ECHAM5OM -SR-B11.79 7 31 IPSLCM4 - SR--3.00 7A1B1.85 9 45 ECHO-G - SR-B1 -2.97 91.87 11 35 MIROC3.2-1.97 11medres - SR-A21.92 12 32 IPSLCM4 - SR-B1 -1.62 121.96 14 29 INMCM3.0 - SR-B12.01 16 34 MIROC3.2 hires -SR-B1-1.48 14-0.74 1623 GISSE-R - SR-A2 2.06 18 43 ECHO-G - SR-A2 -0.38 183 BCM2.0 - SR-B1 2.11 19 52 MIROC3.20.16 19medres - SR-A1B41 CSIROMk3 - SR- 2.13 21 55 NCARCCSM3 - 1.33 21A1BSR-B137 MRI CGCM2.3.2a 2.14 23 51 HADCM3 - SR-B1 1.75 23- SR-A222 GISSE-H - SR-A1B 2.21 24 41 CSIROMk3 - SR-A1B1.77 24Table 6.4 continued on next page


