ClimateChange Assessment Guide.pdf - University of Waterloo
ClimateChange Assessment Guide.pdf - University of Waterloo
ClimateChange Assessment Guide.pdf - University of Waterloo
You also want an ePaper? Increase the reach of your titles
YUMPU automatically turns print PDFs into web optimized ePapers that Google loves.
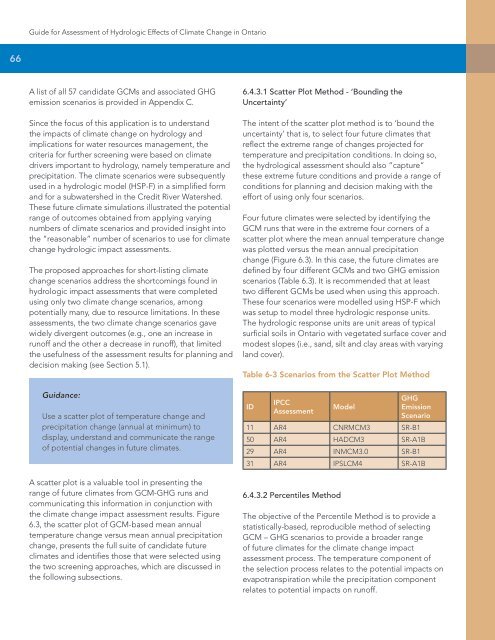
<strong>Guide</strong> for <strong>Assessment</strong> <strong>of</strong> Hydrologic Effects <strong>of</strong> Climate Change in Ontario66A list <strong>of</strong> all 57 candidate GCMs and associated GHGemission scenarios is provided in Appendix C.Since the focus <strong>of</strong> this application is to understandthe impacts <strong>of</strong> climate change on hydrology andimplications for water resources management, thecriteria for further screening were based on climatedrivers important to hydrology, namely temperature andprecipitation. The climate scenarios were subsequentlyused in a hydrologic model (HSP-F) in a simplified formand for a subwatershed in the Credit River Watershed.These future climate simulations illustrated the potentialrange <strong>of</strong> outcomes obtained from applying varyingnumbers <strong>of</strong> climate scenarios and provided insight intothe “reasonable” number <strong>of</strong> scenarios to use for climatechange hydrologic impact assessments.The proposed approaches for short-listing climatechange scenarios address the shortcomings found inhydrologic impact assessments that were completedusing only two climate change scenarios, amongpotentially many, due to resource limitations. In theseassessments, the two climate change scenarios gavewidely divergent outcomes (e.g., one an increase inrun<strong>of</strong>f and the other a decrease in run<strong>of</strong>f), that limitedthe usefulness <strong>of</strong> the assessment results for planning anddecision making (see Section 5.1).Guidance:Use a scatter plot <strong>of</strong> temperature change andprecipitation change (annual at minimum) todisplay, understand and communicate the range<strong>of</strong> potential changes in future climates.A scatter plot is a valuable tool in presenting therange <strong>of</strong> future climates from GCM-GHG runs andcommunicating this information in conjunction withthe climate change impact assessment results. Figure6.3, the scatter plot <strong>of</strong> GCM-based mean annualtemperature change versus mean annual precipitationchange, presents the full suite <strong>of</strong> candidate futureclimates and identifies those that were selected usingthe two screening approaches, which are discussed inthe following subsections.6.4.3.1 Scatter Plot Method - ‘Bounding theUncertainty’The intent <strong>of</strong> the scatter plot method is to ‘bound theuncertainty’ that is, to select four future climates thatreflect the extreme range <strong>of</strong> changes projected fortemperature and precipitation conditions. In doing so,the hydrological assessment should also “capture”these extreme future conditions and provide a range <strong>of</strong>conditions for planning and decision making with theeffort <strong>of</strong> using only four scenarios.Four future climates were selected by identifying theGCM runs that were in the extreme four corners <strong>of</strong> ascatter plot where the mean annual temperature changewas plotted versus the mean annual precipitationchange (Figure 6.3). In this case, the future climates aredefined by four different GCMs and two GHG emissionscenarios (Table 6.3). It is recommended that at leasttwo different GCMs be used when using this approach.These four scenarios were modelled using HSP-F whichwas setup to model three hydrologic response units.The hydrologic response units are unit areas <strong>of</strong> typicalsurficial soils in Ontario with vegetated surface cover andmodest slopes (i.e., sand, silt and clay areas with varyingland cover).Table 6‐3 Scenarios from the Scatter Plot MethodIDIPCC<strong>Assessment</strong>ModelGHGEmissionScenario11 AR4 CNRMCM3 SR-B150 AR4 HADCM3 SR-A1B29 AR4 INMCM3.0 SR-B131 AR4 IPSLCM4 SR-A1B6.4.3.2 Percentiles MethodThe objective <strong>of</strong> the Percentile Method is to provide astatistically-based, reproducible method <strong>of</strong> selectingGCM – GHG scenarios to provide a broader range<strong>of</strong> future climates for the climate change impactassessment process. The temperature component <strong>of</strong>the selection process relates to the potential impacts onevapotranspiration while the precipitation componentrelates to potential impacts on run<strong>of</strong>f.


