ClimateChange Assessment Guide.pdf - University of Waterloo
ClimateChange Assessment Guide.pdf - University of Waterloo
ClimateChange Assessment Guide.pdf - University of Waterloo
You also want an ePaper? Increase the reach of your titles
YUMPU automatically turns print PDFs into web optimized ePapers that Google loves.
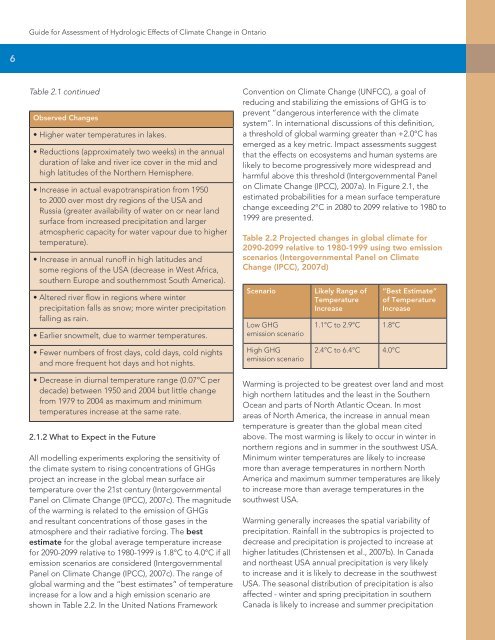
<strong>Guide</strong> for <strong>Assessment</strong> <strong>of</strong> Hydrologic Effects <strong>of</strong> Climate Change in Ontario6Table 2.1 continuedObserved Changes• Higher water temperatures in lakes.• Reductions (approximately two weeks) in the annualduration <strong>of</strong> lake and river ice cover in the mid andhigh latitudes <strong>of</strong> the Northern Hemisphere.• Increase in actual evapotranspiration from 1950to 2000 over most dry regions <strong>of</strong> the USA andRussia (greater availability <strong>of</strong> water on or near landsurface from increased precipitation and largeratmospheric capacity for water vapour due to highertemperature).• Increase in annual run<strong>of</strong>f in high latitudes andsome regions <strong>of</strong> the USA (decrease in West Africa,southern Europe and southernmost South America).• Altered river flow in regions where winterprecipitation falls as snow; more winter precipitationfalling as rain.• Earlier snowmelt, due to warmer temperatures.• Fewer numbers <strong>of</strong> frost days, cold days, cold nightsand more frequent hot days and hot nights.• Decrease in diurnal temperature range (0.07°C perdecade) between 1950 and 2004 but little changefrom 1979 to 2004 as maximum and minimumtemperatures increase at the same rate.2.1.2 What to Expect in the FutureAll modelling experiments exploring the sensitivity <strong>of</strong>the climate system to rising concentrations <strong>of</strong> GHGsproject an increase in the global mean surface airtemperature over the 21st century (IntergovernmentalPanel on Climate Change (IPCC), 2007c). The magnitude<strong>of</strong> the warming is related to the emission <strong>of</strong> GHGsand resultant concentrations <strong>of</strong> those gases in theatmosphere and their radiative forcing. The bestestimate for the global average temperature increasefor 2090-2099 relative to 1980-1999 is 1.8°C to 4.0°C if allemission scenarios are considered (IntergovernmentalPanel on Climate Change (IPCC), 2007c). The range <strong>of</strong>global warming and the “best estimates” <strong>of</strong> temperatureincrease for a low and a high emission scenario areshown in Table 2.2. In the United Nations FrameworkConvention on Climate Change (UNFCC), a goal <strong>of</strong>reducing and stabilizing the emissions <strong>of</strong> GHG is toprevent “dangerous interference with the climatesystem”. In international discussions <strong>of</strong> this definition,a threshold <strong>of</strong> global warming greater than +2.0°C hasemerged as a key metric. Impact assessments suggestthat the effects on ecosystems and human systems arelikely to become progressively more widespread andharmful above this threshold (Intergovernmental Panelon Climate Change (IPCC), 2007a). In Figure 2.1, theestimated probabilities for a mean surface temperaturechange exceeding 2°C in 2080 to 2099 relative to 1980 to1999 are presented.Table 2.2 Projected changes in global climate for2090-2099 relative to 1980-1999 using two emissionscenarios (Intergovernmental Panel on <strong>ClimateChange</strong> (IPCC), 2007d)ScenarioLow GHGemission scenarioHigh GHGemission scenarioLikely Range <strong>of</strong>TemperatureIncrease1.1°C to 2.9°C2.4°C to 6.4°C“Best Estimate”<strong>of</strong> TemperatureIncrease1.8°C4.0°CWarming is projected to be greatest over land and mosthigh northern latitudes and the least in the SouthernOcean and parts <strong>of</strong> North Atlantic Ocean. In mostareas <strong>of</strong> North America, the increase in annual meantemperature is greater than the global mean citedabove. The most warming is likely to occur in winter innorthern regions and in summer in the southwest USA.Minimum winter temperatures are likely to increasemore than average temperatures in northern NorthAmerica and maximum summer temperatures are likelyto increase more than average temperatures in thesouthwest USA.Warming generally increases the spatial variability <strong>of</strong>precipitation. Rainfall in the subtropics is projected todecrease and precipitation is projected to increase athigher latitudes (Christensen et al., 2007b). In Canadaand northeast USA annual precipitation is very likelyto increase and it is likely to decrease in the southwestUSA. The seasonal distribution <strong>of</strong> precipitation is alsoaffected - winter and spring precipitation in southernCanada is likely to increase and summer precipitation


