ClimateChange Assessment Guide.pdf - University of Waterloo
ClimateChange Assessment Guide.pdf - University of Waterloo
ClimateChange Assessment Guide.pdf - University of Waterloo
Create successful ePaper yourself
Turn your PDF publications into a flip-book with our unique Google optimized e-Paper software.
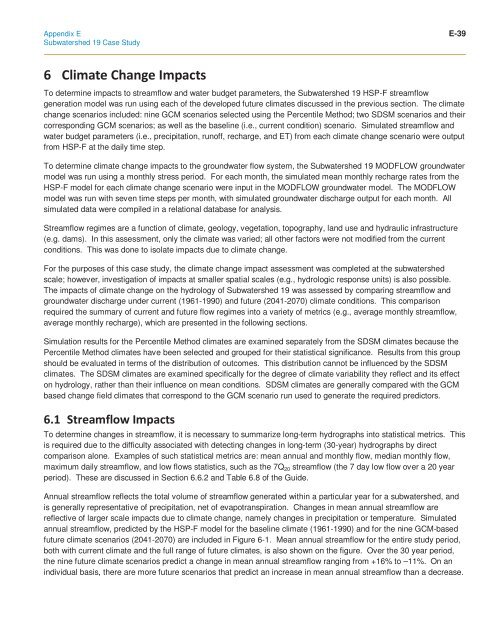
Appendix E E-39Subwatershed 19 Case Study To determine impacts to streamflow and water budget parameters, the Subwatershed 19 HSP-F streamflowgeneration model was run using each <strong>of</strong> the developed future climates discussed in the previous section. The climatechange scenarios included: nine GCM scenarios selected using the Percentile Method; two SDSM scenarios and theircorresponding GCM scenarios; as well as the baseline (i.e., current condition) scenario. Simulated streamflow andwater budget parameters (i.e., precipitation, run<strong>of</strong>f, recharge, and ET) from each climate change scenario were outputfrom HSP-F at the daily time step.To determine climate change impacts to the groundwater flow system, the Subwatershed 19 MODFLOW groundwatermodel was run using a monthly stress period. For each month, the simulated mean monthly recharge rates from theHSP-F model for each climate change scenario were input in the MODFLOW groundwater model. The MODFLOWmodel was run with seven time steps per month, with simulated groundwater discharge output for each month. Allsimulated data were compiled in a relational database for analysis.Streamflow regimes are a function <strong>of</strong> climate, geology, vegetation, topography, land use and hydraulic infrastructure(e.g. dams). In this assessment, only the climate was varied; all other factors were not modified from the currentconditions. This was done to isolate impacts due to climate change.For the purposes <strong>of</strong> this case study, the climate change impact assessment was completed at the subwatershedscale; however, investigation <strong>of</strong> impacts at smaller spatial scales (e.g., hydrologic response units) is also possible.The impacts <strong>of</strong> climate change on the hydrology <strong>of</strong> Subwatershed 19 was assessed by comparing streamflow andgroundwater discharge under current (1961-1990) and future (2041-2070) climate conditions. This comparisonrequired the summary <strong>of</strong> current and future flow regimes into a variety <strong>of</strong> metrics (e.g., average monthly streamflow,average monthly recharge), which are presented in the following sections.Simulation results for the Percentile Method climates are examined separately from the SDSM climates because thePercentile Method climates have been selected and grouped for their statistical significance. Results from this groupshould be evaluated in terms <strong>of</strong> the distribution <strong>of</strong> outcomes. This distribution cannot be influenced by the SDSMclimates. The SDSM climates are examined specifically for the degree <strong>of</strong> climate variability they reflect and its effecton hydrology, rather than their influence on mean conditions. SDSM climates are generally compared with the GCMbased change field climates that correspond to the GCM scenario run used to generate the required predictors. To determine changes in streamflow, it is necessary to summarize long-term hydrographs into statistical metrics. Thisis required due to the difficulty associated with detecting changes in long-term (30-year) hydrographs by directcomparison alone. Examples <strong>of</strong> such statistical metrics are: mean annual and monthly flow, median monthly flow,maximum daily streamflow, and low flows statistics, such as the 7Q 20 streamflow (the 7 day low flow over a 20 yearperiod). These are discussed in Section 6.6.2 and Table 6.8 <strong>of</strong> the <strong>Guide</strong>.Annual streamflow reflects the total volume <strong>of</strong> streamflow generated within a particular year for a subwatershed, andis generally representative <strong>of</strong> precipitation, net <strong>of</strong> evapotranspiration. Changes in mean annual streamflow arereflective <strong>of</strong> larger scale impacts due to climate change, namely changes in precipitation or temperature. Simulatedannual streamflow, predicted by the HSP-F model for the baseline climate (1961-1990) and for the nine GCM-basedfuture climate scenarios (2041-2070) are included in Figure 6-1. Mean annual streamflow for the entire study period,both with current climate and the full range <strong>of</strong> future climates, is also shown on the figure. Over the 30 year period,the nine future climate scenarios predict a change in mean annual streamflow ranging from +16% to –11%. On anindividual basis, there are more future scenarios that predict an increase in mean annual streamflow than a decrease.


