

ClimateChange Assessment Guide.pdf - University of Waterloo
ClimateChange Assessment Guide.pdf - University of Waterloo
ClimateChange Assessment Guide.pdf - University of Waterloo

Create successful ePaper yourself
Turn your PDF publications into a flip-book with our unique Google optimized e-Paper software.
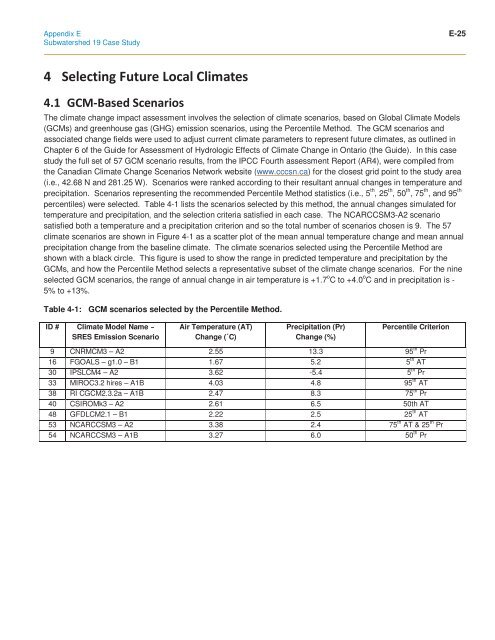
Appendix E E-25Subwatershed 19 Case Study The climate change impact assessment involves the selection <strong>of</strong> climate scenarios, based on Global Climate Models(GCMs) and greenhouse gas (GHG) emission scenarios, using the Percentile Method. The GCM scenarios andassociated change fields were used to adjust current climate parameters to represent future climates, as outlined inChapter 6 <strong>of</strong> the <strong>Guide</strong> for <strong>Assessment</strong> <strong>of</strong> Hydrologic Effects <strong>of</strong> Climate Change in Ontario (the <strong>Guide</strong>). In this casestudy the full set <strong>of</strong> 57 GCM scenario results, from the IPCC Fourth assessment Report (AR4), were compiled fromthe Canadian Climate Change Scenarios Network website (www.cccsn.ca) for the closest grid point to the study area(i.e., 42.68 N and 281.25 W). Scenarios were ranked according to their resultant annual changes in temperature andprecipitation. Scenarios representing the recommended Percentile Method statistics (i.e., 5 th , 25 th , 50 th , 75 th , and 95 thpercentiles) were selected. Table 4-1 lists the scenarios selected by this method, the annual changes simulated fortemperature and precipitation, and the selection criteria satisfied in each case. The NCARCCSM3-A2 scenariosatisfied both a temperature and a precipitation criterion and so the total number <strong>of</strong> scenarios chosen is 9. The 57climate scenarios are shown in Figure 4-1 as a scatter plot <strong>of</strong> the mean annual temperature change and mean annualprecipitation change from the baseline climate. The climate scenarios selected using the Percentile Method areshown with a black circle. This figure is used to show the range in predicted temperature and precipitation by theGCMs, and how the Percentile Method selects a representative subset <strong>of</strong> the climate change scenarios. For the nineselected GCM scenarios, the range <strong>of</strong> annual change in air temperature is +1.7 o C to +4.0 o C and in precipitation is -5% to +13%.Table 4-1: GCM scenarios selected by the Percentile Method.ID # Climate Model Name –SRES Emission ScenarioAir Temperature (AT)Change (˚C)Precipitation (Pr)Change (%)Percentile Criterion9 CNRMCM3 – A2 2.55 13.3 95 th Pr16 FGOALS – g1.0 – B1 1.67 5.2 5 th AT30 IPSLCM4 – A2 3.62 -5.4 5 th Pr33 MIROC3.2 hires – A1B 4.03 4.8 95 th AT38 RI CGCM2.3.2a – A1B 2.47 8.3 75 th Pr40 CSIROMk3 – A2 2.61 6.5 50th AT48 GFDLCM2.1 – B1 2.22 2.5 25 th AT53 NCARCCSM3 – A2 3.38 2.4 75 th AT & 25 th Pr54 NCARCCSM3 – A1B 3.27 6.0 50 th Pr


