

ClimateChange Assessment Guide.pdf - University of Waterloo
ClimateChange Assessment Guide.pdf - University of Waterloo
ClimateChange Assessment Guide.pdf - University of Waterloo

Create successful ePaper yourself
Turn your PDF publications into a flip-book with our unique Google optimized e-Paper software.
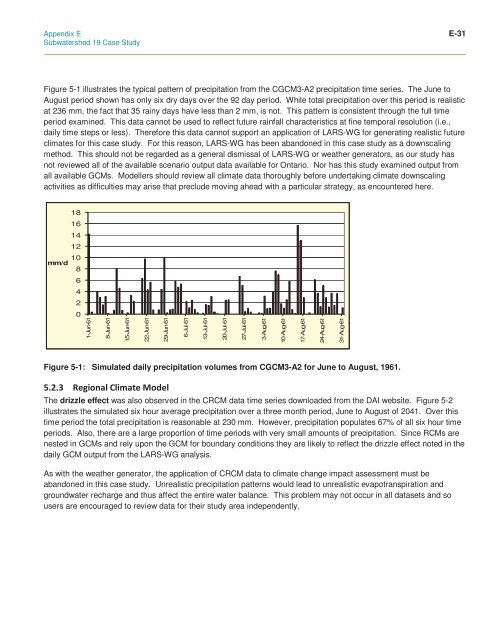
Appendix E E-31Subwatershed 19 Case StudyFigure 5-1 illustrates the typical pattern <strong>of</strong> precipitation from the CGCM3-A2 precipitation time series. The June toAugust period shown has only six dry days over the 92 day period. While total precipitation over this period is realisticat 236 mm, the fact that 35 rainy days have less than 2 mm, is not. This pattern is consistent through the full timeperiod examined. This data cannot be used to reflect future rainfall characteristics at fine temporal resolution (i.e.,daily time steps or less). Therefore this data cannot support an application <strong>of</strong> LARS-WG for generating realistic futureclimates for this case study. For this reason, LARS-WG has been abandoned in this case study as a downscalingmethod. This should not be regarded as a general dismissal <strong>of</strong> LARS-WG or weather generators, as our study hasnot reviewed all <strong>of</strong> the available scenario output data available for Ontario. Nor has this study examined output fromall available GCMs. Modellers should review all climate data thoroughly before undertaking climate downscalingactivities as difficulties may arise that preclude moving ahead with a particular strategy, as encountered here.1816141210mm/d864201-Jun-618-Jun-6115-Jun-6122-Jun-6129-Jun-616-Jul-6113-Jul-6120-Jul-6127-Jul-613-Aug-6110-Aug-6117-Aug-6124-Aug-6131-Aug-61Figure 5-1: Simulated daily precipitation volumes from CGCM3-A2 for June to August, 1961. The drizzle effect was also observed in the CRCM data time series downloaded from the DAI website. Figure 5-2illustrates the simulated six hour average precipitation over a three month period, June to August <strong>of</strong> 2041. Over thistime period the total precipitation is reasonable at 230 mm. However, precipitation populates 67% <strong>of</strong> all six hour timeperiods. Also, there are a large proportion <strong>of</strong> time periods with very small amounts <strong>of</strong> precipitation. Since RCMs arenested in GCMs and rely upon the GCM for boundary conditions they are likely to reflect the drizzle effect noted in thedaily GCM output from the LARS-WG analysis.As with the weather generator, the application <strong>of</strong> CRCM data to climate change impact assessment must beabandoned in this case study. Unrealistic precipitation patterns would lead to unrealistic evapotranspiration andgroundwater recharge and thus affect the entire water balance. This problem may not occur in all datasets and sousers are encouraged to review data for their study area independently.


