<strong>Guide</strong> for <strong>Assessment</strong> <strong>of</strong> Hydrologic Effects <strong>of</strong> Climate Change in Ontario44increases in storm intensity promote relatively greateramounts <strong>of</strong> overland flow and run<strong>of</strong>f relative toinfiltration. Thus, if an increase in annual precipitationis solely attributed to increases in storm intensity thenrecharge to groundwater can be expected to remainthe same or perhaps be reduced.• Due to increasing temperatures, the timing <strong>of</strong> majorrecharge events associated with the spring snowmeltmay shift to earlier in the year. Additionally, theduration <strong>of</strong> major recharge events may be extended,and thus recharge volume increased, during thesnowmelt season.• Possible increases in potential evapotranspiration withclimate change, may cause the unsaturated soil zoneto dry faster (spring) or take longer to return to wetconditions (fall), thereby reducing recharge in thoseseasons.5.2.4 StreamflowWhile there are various definitions available, for thepurposes <strong>of</strong> this discussion streamflow contributionsinclude groundwater discharge from seeps andsprings, interflow and surface overland run<strong>of</strong>f as wellas anthropogenic sources such as municipal andindustrial effluents and diversions. Precipitation fallingdirectly on the stream also contributes to streamflow;however, its role is typically insignificant relative to othercontributions.Baseflow is the portion <strong>of</strong> streamflow that persists duringdry periods with no rain or snowmelt. Baseflow maycome from depletion <strong>of</strong> surface storage but in SouthernOntario most baseflow comes from groundwaterdischarging to surface ditches, drains, streams andrivers. Baseflow from groundwater occurs throughout theyear at varying rates according to groundwater storageconditions that, in turn, are dependent on previousrecharge amounts. Discharge <strong>of</strong> groundwater to streamsis dependent on the elevation <strong>of</strong> the local groundwatertable being higher than that <strong>of</strong> the streambed.Interflow, also referred to as subsurface storm flow, isthe lateral movement <strong>of</strong> water that enter fissures andmacropores in the upper soil pr<strong>of</strong>ile from localizedpockets <strong>of</strong> saturation either in the vadose zone, orjust below the water table surface, and discharge tothe receiving stream channel during the storm event.Flow discharging to the stream channel from buriedpipe agricultural drains (tile drainage) is, strictlyspeaking discharge <strong>of</strong> groundwater but has the sametiming characteristics as interflow and is commonlyincluded with interflow in hydrologic models. Theprime requirement <strong>of</strong> interflow is a sloping soil horizon<strong>of</strong> high infiltrability and lateral permeability with animpeding layer at shallow depth. This is quite commonin agricultural areas, and is almost always present onforested valley side slopes. Interflow is most common inthe spring following snowmelt when soil water storageamounts are typically high.Surface run<strong>of</strong>f is the portion <strong>of</strong> overland flow that directlyflows into the stream over the surface <strong>of</strong> the land. Itis recognized that overland flow in humid, vegetatedcatchments is a rare occurrence both spatially andtemporally (Freeze and Cherry, 1979). Surface run<strong>of</strong>fduring storms and snowmelt periods is responsible forflooding events. Surface run<strong>of</strong>f is particularly importantin areas with low permeability soils (i.e., clays and clayloams and frozen ground conditions) and in areas withthe water table at the soil surface. For these surfaceslittle or no infiltration occurs and most, or all, waterreaching the surface as rain, snowmelt or surface flowfrom upslope, leaves the area as surface run<strong>of</strong>f, or isponded above the surface as depression storage.The anthropogenic sources <strong>of</strong> streamflow (irrigationreturn flow, wastewater effluent, urban stormwater) arestrongly influenced by future management decisions andland use changes and this complicates the assessment<strong>of</strong> climate-change effects. Effluent discharge rates underfuture conditions are likely to be modified from currentrates by changes in population, urbanization trends,water consumption practices, technologies employed,altered climate and external forces (i.e., policy,legislation). Likewise, anthropogenic water sources suchas stormwater and other non-contaminated dischargeswill be influenced by human activity and trends in thefuture. Any assessment <strong>of</strong> streamflow with climatechange must account for these other flow sources andtheir likelihood <strong>of</strong> change.Hydrologic models sum baseflow, interflow and run<strong>of</strong>fcomponents to create an outflow hydrograph from aspecified spatial area or catchment. This catchmenthydrograph is added to the stream network, and usingchannel characteristics such as slope, length, roughnessand cross section geometry, is routed downstream.Hydrographs are also routed through online ponds, lakesand reservoirs. Storage within the channel/ponds acts to
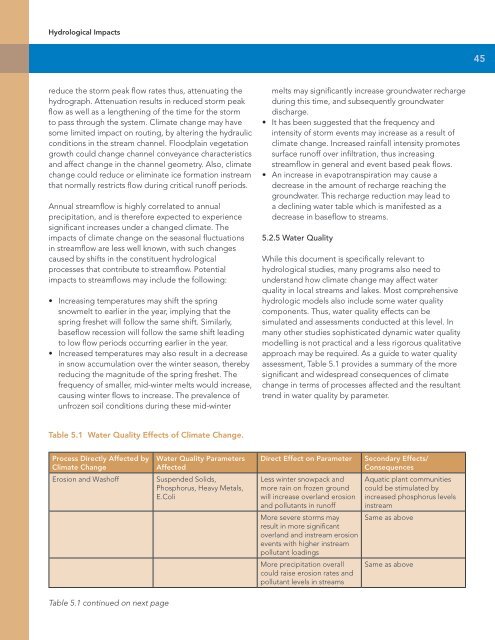
Hydrological Impacts45reduce the storm peak flow rates thus, attenuating thehydrograph. Attenuation results in reduced storm peakflow as well as a lengthening <strong>of</strong> the time for the stormto pass through the system. Climate change may havesome limited impact on routing, by altering the hydraulicconditions in the stream channel. Floodplain vegetationgrowth could change channel conveyance characteristicsand affect change in the channel geometry. Also, climatechange could reduce or eliminate ice formation instreamthat normally restricts flow during critical run<strong>of</strong>f periods.Annual streamflow is highly correlated to annualprecipitation, and is therefore expected to experiencesignificant increases under a changed climate. Theimpacts <strong>of</strong> climate change on the seasonal fluctuationsin streamflow are less well known, with such changescaused by shifts in the constituent hydrologicalprocesses that contribute to streamflow. Potentialimpacts to streamflows may include the following:• Increasing temperatures may shift the springsnowmelt to earlier in the year, implying that thespring freshet will follow the same shift. Similarly,baseflow recession will follow the same shift leadingto low flow periods occurring earlier in the year.• Increased temperatures may also result in a decreasein snow accumulation over the winter season, therebyreducing the magnitude <strong>of</strong> the spring freshet. Thefrequency <strong>of</strong> smaller, mid-winter melts would increase,causing winter flows to increase. The prevalence <strong>of</strong>unfrozen soil conditions during these mid-wintermelts may significantly increase groundwater rechargeduring this time, and subsequently groundwaterdischarge.• It has been suggested that the frequency andintensity <strong>of</strong> storm events may increase as a result <strong>of</strong>climate change. Increased rainfall intensity promotessurface run<strong>of</strong>f over infiltration, thus increasingstreamflow in general and event based peak flows.• An increase in evapotranspiration may cause adecrease in the amount <strong>of</strong> recharge reaching thegroundwater. This recharge reduction may lead toa declining water table which is manifested as adecrease in baseflow to streams.5.2.5 Water QualityWhile this document is specifically relevant tohydrological studies, many programs also need tounderstand how climate change may affect waterquality in local streams and lakes. Most comprehensivehydrologic models also include some water qualitycomponents. Thus, water quality effects can besimulated and assessments conducted at this level. Inmany other studies sophisticated dynamic water qualitymodelling is not practical and a less rigorous qualitativeapproach may be required. As a guide to water qualityassessment, Table 5.1 provides a summary <strong>of</strong> the moresignificant and widespread consequences <strong>of</strong> climatechange in terms <strong>of</strong> processes affected and the resultanttrend in water quality by parameter.Table 5.1 Water Quality Effects <strong>of</strong> Climate Change.Process Directly Affected byClimate ChangeErosion and Wash<strong>of</strong>fWater Quality ParametersAffectedSuspended Solids,Phosphorus, Heavy Metals,E.ColiDirect Effect on ParameterSecondary Effects/ConsequencesAquatic plant communitiescould be stimulated byincreased phosphorus levelsinstreamSame as aboveLess winter snowpack andmore rain on frozen groundwill increase overland erosionand pollutants in run<strong>of</strong>fMore severe storms mayresult in more significantoverland and instream erosionevents with higher instreampollutant loadingsMore precipitation overallcould raise erosion rates andpollutant levels in streamsSame as aboveTable 5.1 continued on next page