

ClimateChange Assessment Guide.pdf - University of Waterloo
ClimateChange Assessment Guide.pdf - University of Waterloo
ClimateChange Assessment Guide.pdf - University of Waterloo

Create successful ePaper yourself
Turn your PDF publications into a flip-book with our unique Google optimized e-Paper software.
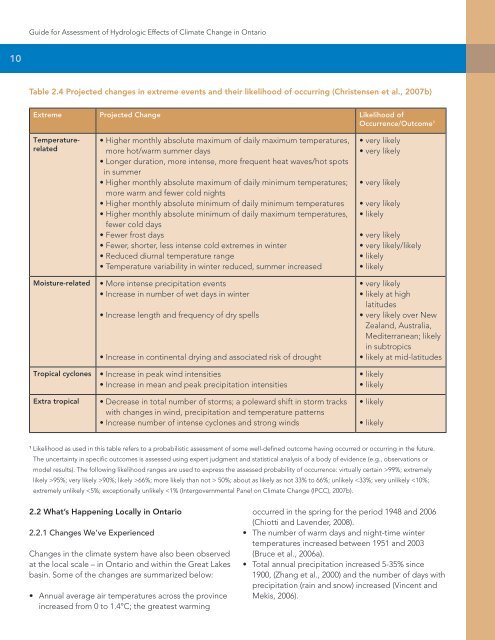
<strong>Guide</strong> for <strong>Assessment</strong> <strong>of</strong> Hydrologic Effects <strong>of</strong> Climate Change in Ontario10Table 2.4 Projected changes in extreme events and their likelihood <strong>of</strong> occurring (Christensen et al., 2007b)Extreme Projected Change Likelihood <strong>of</strong>Occurrence/Outcome 1TemperaturerelatedMoisture-relatedTropical cyclonesExtra tropical• Higher monthly absolute maximum <strong>of</strong> daily maximum temperatures,more hot/warm summer days•Longer duration, more intense, more frequent heat waves/hot spotsin summer• Higher monthly absolute maximum <strong>of</strong> daily minimum temperatures;more warm and fewer cold nights• Higher monthly absolute minimum <strong>of</strong> daily minimum temperatures• Higher monthly absolute minimum <strong>of</strong> daily maximum temperatures,fewer cold days• Fewer frost days• Fewer, shorter, less intense cold extremes in winter• Reduced diurnal temperature range• Temperature variability in winter reduced, summer increased• More intense precipitation events• Increase in number <strong>of</strong> wet days in winter• Increase length and frequency <strong>of</strong> dry spells• Increase in continental drying and associated risk <strong>of</strong> drought• Increase in peak wind intensities• Increase in mean and peak precipitation intensities• Decrease in total number <strong>of</strong> storms; a poleward shift in storm trackswith changes in wind, precipitation and temperature patterns• Increase number <strong>of</strong> intense cyclones and strong winds• very likely• very likely• very likely• very likely• likely• very likely• very likely/likely• likely• likely• very likely• likely at highlatitudes• very likely over NewZealand, Australia,Mediterranean; likelyin subtropics• likely at mid-latitudes• likely• likely• likely• likely1Likelihood as used in this table refers to a probabilistic assessment <strong>of</strong> some well-defined outcome having occurred or occurring in the future.The uncertainty in specific outcomes is assessed using expert judgment and statistical analysis <strong>of</strong> a body <strong>of</strong> evidence (e.g., observations ormodel results). The following likelihood ranges are used to express the assessed probability <strong>of</strong> occurrence: virtually certain >99%; extremelylikely >95%; very likely >90%; likely >66%; more likely than not > 50%; about as likely as not 33% to 66%; unlikely


