

ClimateChange Assessment Guide.pdf - University of Waterloo
ClimateChange Assessment Guide.pdf - University of Waterloo
ClimateChange Assessment Guide.pdf - University of Waterloo

You also want an ePaper? Increase the reach of your titles
YUMPU automatically turns print PDFs into web optimized ePapers that Google loves.
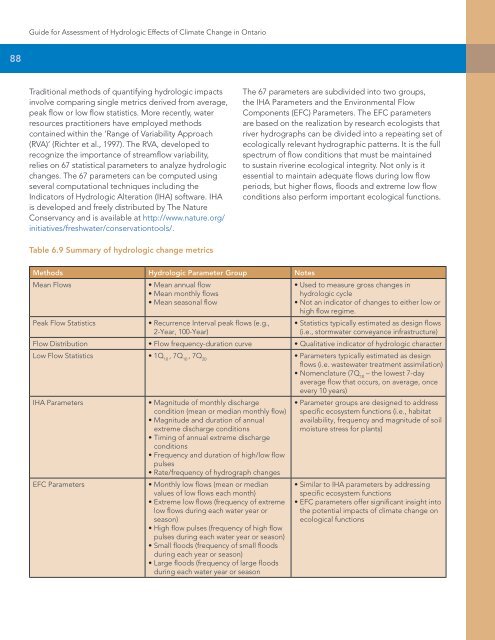
<strong>Guide</strong> for <strong>Assessment</strong> <strong>of</strong> Hydrologic Effects <strong>of</strong> Climate Change in Ontario88Traditional methods <strong>of</strong> quantifying hydrologic impactsinvolve comparing single metrics derived from average,peak flow or low flow statistics. More recently, waterresources practitioners have employed methodscontained within the ‘Range <strong>of</strong> Variability Approach(RVA)’ (Richter et al., 1997). The RVA, developed torecognize the importance <strong>of</strong> streamflow variability,relies on 67 statistical parameters to analyze hydrologicchanges. The 67 parameters can be computed usingseveral computational techniques including theIndicators <strong>of</strong> Hydrologic Alteration (IHA) s<strong>of</strong>tware. IHAis developed and freely distributed by The NatureConservancy and is available at http://www.nature.org/initiatives/freshwater/conservationtools/.The 67 parameters are subdivided into two groups,the IHA Parameters and the Environmental FlowComponents (EFC) Parameters. The EFC parametersare based on the realization by research ecologists thatriver hydrographs can be divided into a repeating set <strong>of</strong>ecologically relevant hydrographic patterns. It is the fullspectrum <strong>of</strong> flow conditions that must be maintainedto sustain riverine ecological integrity. Not only is itessential to maintain adequate flows during low flowperiods, but higher flows, floods and extreme low flowconditions also perform important ecological functions.Table 6.9 Summary <strong>of</strong> hydrologic change metricsMethods Hydrologic Parameter Group NotesMean FlowsPeak Flow Statistics• Mean annual flow• Mean monthly flows• Mean seasonal flow• Recurrence Interval peak flows (e.g.,2-Year, 100-Year)• Used to measure gross changes inhydrologic cycle• Not an indicator <strong>of</strong> changes to either low orhigh flow regime.• Statistics typically estimated as design flows(i.e., stormwater conveyance infrastructure)Flow Distribution • Flow frequency-duration curve • Qualitative indicator <strong>of</strong> hydrologic characterLow Flow Statistics • 1Q 10, 7Q 10, 7Q 20• Parameters typically estimated as designflows (i.e. wastewater treatment assimilation)• Nomenclature (7Q 10– the lowest 7-dayaverage flow that occurs, on average, onceevery 10 years)IHA Parameters• Magnitude <strong>of</strong> monthly dischargecondition (mean or median monthly flow)• Magnitude and duration <strong>of</strong> annualextreme discharge conditions• Timing <strong>of</strong> annual extreme dischargeconditions• Frequency and duration <strong>of</strong> high/low flowpulses• Rate/frequency <strong>of</strong> hydrograph changes• Parameter groups are designed to addressspecific ecosystem functions (i.e., habitatavailability, frequency and magnitude <strong>of</strong> soilmoisture stress for plants)EFC Parameters• Monthly low flows (mean or medianvalues <strong>of</strong> low flows each month)• Extreme low flows (frequency <strong>of</strong> extremelow flows during each water year orseason)• High flow pulses (frequency <strong>of</strong> high flowpulses during each water year or season)• Small floods (frequency <strong>of</strong> small floodsduring each year or season)• Large floods (frequency <strong>of</strong> large floodsduring each water year or season• Similar to IHA parameters by addressingspecific ecosystem functions• EFC parameters <strong>of</strong>fer significant insight intothe potential impacts <strong>of</strong> climate change onecological functions


